Slavic vs Sierra Leonean Median Household Income
COMPARE
Slavic
Sierra Leonean
Median Household Income
Median Household Income Comparison
Slavs
Sierra Leoneans
$86,398
MEDIAN HOUSEHOLD INCOME
69.7/ 100
METRIC RATING
161st/ 347
METRIC RANK
$88,463
MEDIAN HOUSEHOLD INCOME
89.6/ 100
METRIC RATING
137th/ 347
METRIC RANK
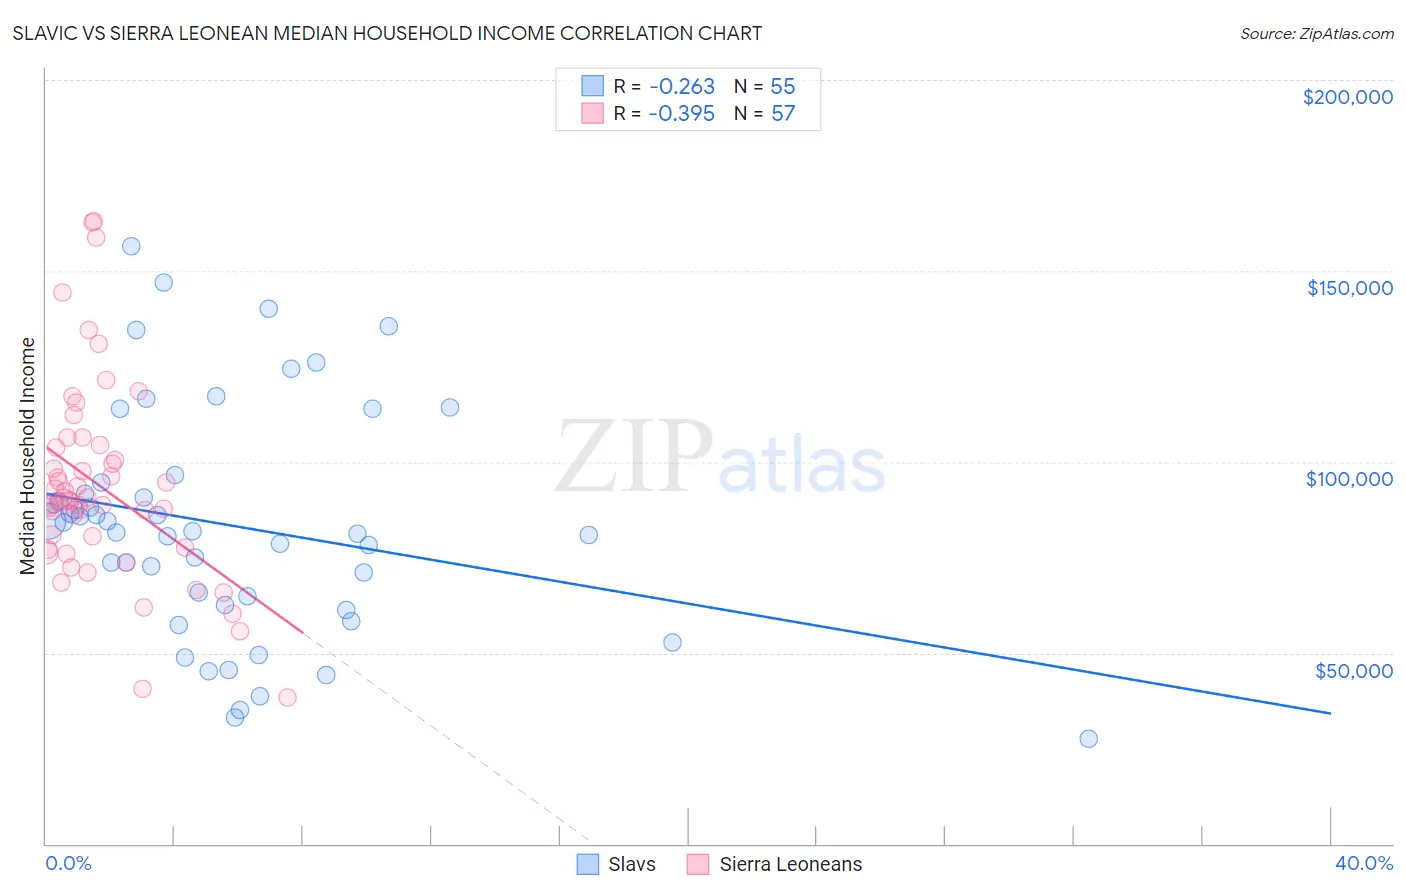
Slavic vs Sierra Leonean Median Household Income Correlation Chart
The statistical analysis conducted on geographies consisting of 270,777,755 people shows a weak negative correlation between the proportion of Slavs and median household income in the United States with a correlation coefficient (R) of -0.263 and weighted average of $86,398. Similarly, the statistical analysis conducted on geographies consisting of 83,336,605 people shows a mild negative correlation between the proportion of Sierra Leoneans and median household income in the United States with a correlation coefficient (R) of -0.395 and weighted average of $88,463, a difference of 2.4%.
Median Household Income Correlation Summary
| Measurement | Slavic | Sierra Leonean |
| Minimum | $27,389 | $38,207 |
| Maximum | $156,479 | $162,895 |
| Range | $129,090 | $124,688 |
| Mean | $83,350 | $93,657 |
| Median | $81,875 | $89,856 |
| Interquartile 25% (IQ1) | $62,500 | $77,308 |
| Interquartile 75% (IQ3) | $94,752 | $103,980 |
| Interquartile Range (IQR) | $32,252 | $26,672 |
| Standard Deviation (Sample) | $29,906 | $25,946 |
| Standard Deviation (Population) | $29,633 | $25,718 |
Similar Demographics by Median Household Income
Demographics Similar to Slavs by Median Household Income
In terms of median household income, the demographic groups most similar to Slavs are Luxembourger ($86,418, a difference of 0.020%), Immigrants from Uzbekistan ($86,425, a difference of 0.030%), Moroccan ($86,468, a difference of 0.080%), Samoan ($86,498, a difference of 0.12%), and Immigrants from Albania ($86,534, a difference of 0.16%).
| Demographics | Rating | Rank | Median Household Income |
| Immigrants | Germany | 74.4 /100 | #154 | Good $86,764 |
| Carpatho Rusyns | 72.8 /100 | #155 | Good $86,635 |
| Immigrants | Albania | 71.5 /100 | #156 | Good $86,534 |
| Samoans | 71.0 /100 | #157 | Good $86,498 |
| Moroccans | 70.6 /100 | #158 | Good $86,468 |
| Immigrants | Uzbekistan | 70.1 /100 | #159 | Good $86,425 |
| Luxembourgers | 70.0 /100 | #160 | Good $86,418 |
| Slavs | 69.7 /100 | #161 | Good $86,398 |
| Guamanians/Chamorros | 67.7 /100 | #162 | Good $86,255 |
| Czechs | 66.4 /100 | #163 | Good $86,164 |
| Irish | 66.2 /100 | #164 | Good $86,145 |
| Norwegians | 65.3 /100 | #165 | Good $86,084 |
| Scandinavians | 65.1 /100 | #166 | Good $86,073 |
| Immigrants | Immigrants | 61.3 /100 | #167 | Good $85,818 |
| Icelanders | 61.0 /100 | #168 | Good $85,797 |
Demographics Similar to Sierra Leoneans by Median Household Income
In terms of median household income, the demographic groups most similar to Sierra Leoneans are Polish ($88,472, a difference of 0.010%), Immigrants from Sierra Leone ($88,498, a difference of 0.040%), Swedish ($88,524, a difference of 0.070%), Arab ($88,398, a difference of 0.070%), and Immigrants from Chile ($88,388, a difference of 0.080%).
| Demographics | Rating | Rank | Median Household Income |
| British | 92.0 /100 | #130 | Exceptional $88,914 |
| Immigrants | Syria | 91.4 /100 | #131 | Exceptional $88,792 |
| Europeans | 91.2 /100 | #132 | Exceptional $88,751 |
| Immigrants | Ethiopia | 90.9 /100 | #133 | Exceptional $88,687 |
| Swedes | 90.0 /100 | #134 | Exceptional $88,524 |
| Immigrants | Sierra Leone | 89.9 /100 | #135 | Excellent $88,498 |
| Poles | 89.7 /100 | #136 | Excellent $88,472 |
| Sierra Leoneans | 89.6 /100 | #137 | Excellent $88,463 |
| Arabs | 89.2 /100 | #138 | Excellent $88,398 |
| Immigrants | Chile | 89.2 /100 | #139 | Excellent $88,388 |
| Lebanese | 87.2 /100 | #140 | Excellent $88,091 |
| Immigrants | Morocco | 86.0 /100 | #141 | Excellent $87,930 |
| Canadians | 84.7 /100 | #142 | Excellent $87,769 |
| Danes | 83.9 /100 | #143 | Excellent $87,676 |
| Serbians | 83.0 /100 | #144 | Excellent $87,572 |