Immigrants from Belgium vs Sierra Leonean Single Female Poverty
COMPARE
Immigrants from Belgium
Sierra Leonean
Single Female Poverty
Single Female Poverty Comparison
Immigrants from Belgium
Sierra Leoneans
19.8%
SINGLE FEMALE POVERTY
97.3/ 100
METRIC RATING
101st/ 347
METRIC RANK
19.7%
SINGLE FEMALE POVERTY
97.9/ 100
METRIC RATING
99th/ 347
METRIC RANK
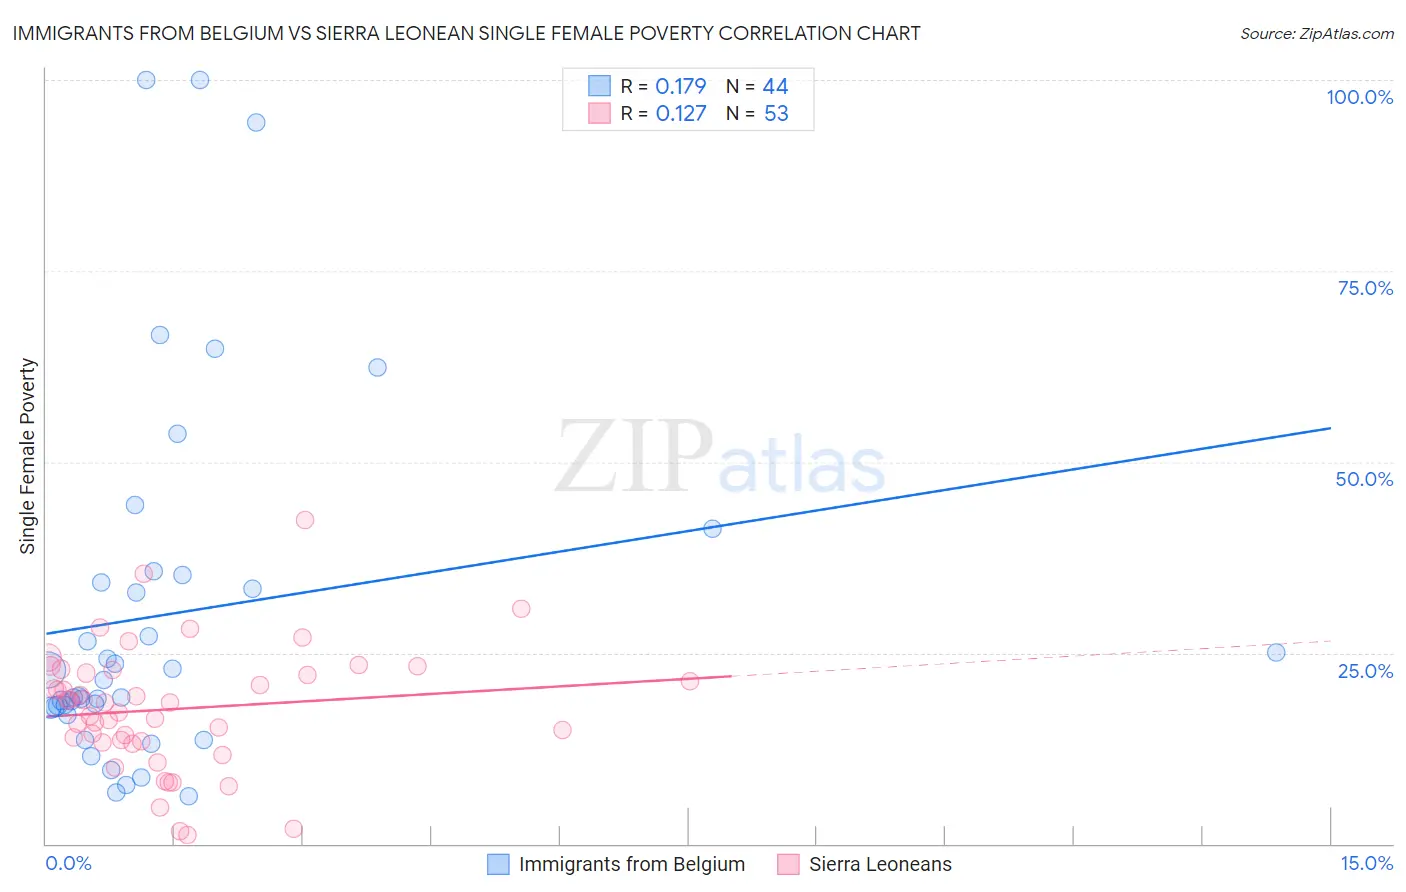
Immigrants from Belgium vs Sierra Leonean Single Female Poverty Correlation Chart
The statistical analysis conducted on geographies consisting of 145,269,497 people shows a poor positive correlation between the proportion of Immigrants from Belgium and poverty level among single females in the United States with a correlation coefficient (R) of 0.179 and weighted average of 19.8%. Similarly, the statistical analysis conducted on geographies consisting of 83,185,885 people shows a poor positive correlation between the proportion of Sierra Leoneans and poverty level among single females in the United States with a correlation coefficient (R) of 0.127 and weighted average of 19.7%, a difference of 0.43%.
Single Female Poverty Correlation Summary
| Measurement | Immigrants from Belgium | Sierra Leonean |
| Minimum | 6.3% | 1.1% |
| Maximum | 100.0% | 42.4% |
| Range | 93.7% | 41.2% |
| Mean | 30.1% | 17.6% |
| Median | 20.4% | 18.6% |
| Interquartile 25% (IQ1) | 17.9% | 13.4% |
| Interquartile 75% (IQ3) | 34.7% | 22.5% |
| Interquartile Range (IQR) | 16.9% | 9.2% |
| Standard Deviation (Sample) | 23.7% | 8.1% |
| Standard Deviation (Population) | 23.5% | 8.0% |
Demographics Similar to Immigrants from Belgium and Sierra Leoneans by Single Female Poverty
In terms of single female poverty, the demographic groups most similar to Immigrants from Belgium are Immigrants from Cameroon (19.8%, a difference of 0.010%), Immigrants from Southern Europe (19.9%, a difference of 0.13%), Ukrainian (19.8%, a difference of 0.18%), Chilean (19.9%, a difference of 0.25%), and Israeli (19.9%, a difference of 0.26%). Similarly, the demographic groups most similar to Sierra Leoneans are Immigrants from France (19.7%, a difference of 0.010%), Croatian (19.7%, a difference of 0.14%), Immigrants from Brazil (19.7%, a difference of 0.23%), Ukrainian (19.8%, a difference of 0.25%), and Estonian (19.7%, a difference of 0.28%).
| Demographics | Rating | Rank | Single Female Poverty |
| Immigrants | Lebanon | 98.8 /100 | #90 | Exceptional 19.6% |
| Soviet Union | 98.8 /100 | #91 | Exceptional 19.6% |
| Italians | 98.8 /100 | #92 | Exceptional 19.6% |
| Immigrants | Austria | 98.8 /100 | #93 | Exceptional 19.6% |
| Romanians | 98.6 /100 | #94 | Exceptional 19.6% |
| Estonians | 98.2 /100 | #95 | Exceptional 19.7% |
| Immigrants | Brazil | 98.2 /100 | #96 | Exceptional 19.7% |
| Croatians | 98.1 /100 | #97 | Exceptional 19.7% |
| Immigrants | France | 97.9 /100 | #98 | Exceptional 19.7% |
| Sierra Leoneans | 97.9 /100 | #99 | Exceptional 19.7% |
| Ukrainians | 97.6 /100 | #100 | Exceptional 19.8% |
| Immigrants | Belgium | 97.3 /100 | #101 | Exceptional 19.8% |
| Immigrants | Cameroon | 97.3 /100 | #102 | Exceptional 19.8% |
| Immigrants | Southern Europe | 97.1 /100 | #103 | Exceptional 19.9% |
| Chileans | 96.9 /100 | #104 | Exceptional 19.9% |
| Israelis | 96.9 /100 | #105 | Exceptional 19.9% |
| Ethiopians | 96.7 /100 | #106 | Exceptional 19.9% |
| Immigrants | Syria | 96.7 /100 | #107 | Exceptional 19.9% |
| Native Hawaiians | 96.6 /100 | #108 | Exceptional 19.9% |
| Colombians | 96.6 /100 | #109 | Exceptional 19.9% |
| Immigrants | Western Asia | 96.5 /100 | #110 | Exceptional 19.9% |