Slavic vs Dutch Householder Income Ages 45 - 64 years
COMPARE
Slavic
Dutch
Householder Income Ages 45 - 64 years
Householder Income Ages 45 - 64 years Comparison
Slavs
Dutch
$102,629
HOUSEHOLDER INCOME AGES 45 - 64 YEARS
76.1/ 100
METRIC RATING
158th/ 347
METRIC RANK
$99,650
HOUSEHOLDER INCOME AGES 45 - 64 YEARS
41.7/ 100
METRIC RATING
186th/ 347
METRIC RANK
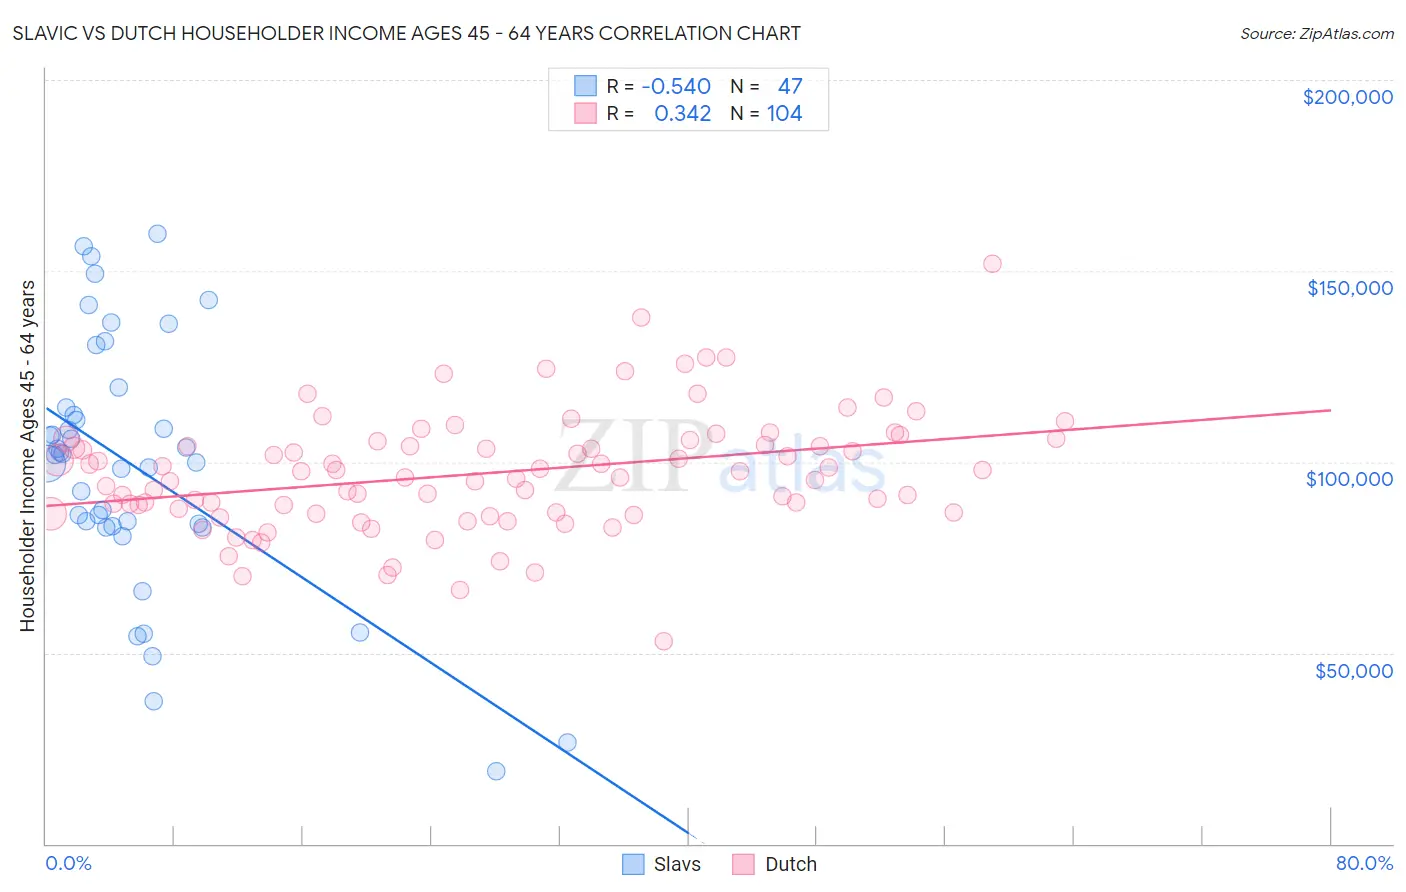
Slavic vs Dutch Householder Income Ages 45 - 64 years Correlation Chart
The statistical analysis conducted on geographies consisting of 270,616,686 people shows a substantial negative correlation between the proportion of Slavs and household income with householder between the ages 45 and 64 in the United States with a correlation coefficient (R) of -0.540 and weighted average of $102,629. Similarly, the statistical analysis conducted on geographies consisting of 551,391,868 people shows a mild positive correlation between the proportion of Dutch and household income with householder between the ages 45 and 64 in the United States with a correlation coefficient (R) of 0.342 and weighted average of $99,650, a difference of 3.0%.
Householder Income Ages 45 - 64 years Correlation Summary
| Measurement | Slavic | Dutch |
| Minimum | $18,979 | $53,125 |
| Maximum | $159,583 | $151,830 |
| Range | $140,604 | $98,705 |
| Mean | $98,663 | $96,972 |
| Median | $101,881 | $96,631 |
| Interquartile 25% (IQ1) | $83,250 | $86,774 |
| Interquartile 75% (IQ3) | $114,292 | $104,984 |
| Interquartile Range (IQR) | $31,042 | $18,210 |
| Standard Deviation (Sample) | $32,811 | $15,436 |
| Standard Deviation (Population) | $32,460 | $15,361 |
Similar Demographics by Householder Income Ages 45 - 64 years
Demographics Similar to Slavs by Householder Income Ages 45 - 64 years
In terms of householder income ages 45 - 64 years, the demographic groups most similar to Slavs are Immigrants from Ethiopia ($102,763, a difference of 0.13%), Carpatho Rusyn ($102,777, a difference of 0.14%), Costa Rican ($102,779, a difference of 0.15%), Sierra Leonean ($102,427, a difference of 0.20%), and Slovene ($102,885, a difference of 0.25%).
| Demographics | Rating | Rank | Householder Income Ages 45 - 64 years |
| Swiss | 79.9 /100 | #151 | Good $103,071 |
| Irish | 79.8 /100 | #152 | Good $103,067 |
| Scandinavians | 79.0 /100 | #153 | Good $102,969 |
| Slovenes | 78.3 /100 | #154 | Good $102,885 |
| Costa Ricans | 77.4 /100 | #155 | Good $102,779 |
| Carpatho Rusyns | 77.4 /100 | #156 | Good $102,777 |
| Immigrants | Ethiopia | 77.3 /100 | #157 | Good $102,763 |
| Slavs | 76.1 /100 | #158 | Good $102,629 |
| Sierra Leoneans | 74.2 /100 | #159 | Good $102,427 |
| Icelanders | 72.5 /100 | #160 | Good $102,261 |
| Immigrants | Nepal | 71.8 /100 | #161 | Good $102,190 |
| Scottish | 71.1 /100 | #162 | Good $102,123 |
| English | 70.1 /100 | #163 | Good $102,021 |
| Immigrants | Morocco | 70.0 /100 | #164 | Good $102,015 |
| Immigrants | Albania | 69.4 /100 | #165 | Good $101,957 |
Demographics Similar to Dutch by Householder Income Ages 45 - 64 years
In terms of householder income ages 45 - 64 years, the demographic groups most similar to Dutch are Colombian ($99,772, a difference of 0.12%), French ($99,824, a difference of 0.17%), Spaniard ($99,889, a difference of 0.24%), Finnish ($99,904, a difference of 0.25%), and Iraqi ($99,387, a difference of 0.27%).
| Demographics | Rating | Rank | Householder Income Ages 45 - 64 years |
| Belgians | 46.7 /100 | #179 | Average $100,060 |
| Aleuts | 46.6 /100 | #180 | Average $100,052 |
| Immigrants | Immigrants | 45.3 /100 | #181 | Average $99,943 |
| Finns | 44.8 /100 | #182 | Average $99,904 |
| Spaniards | 44.6 /100 | #183 | Average $99,889 |
| French | 43.8 /100 | #184 | Average $99,824 |
| Colombians | 43.2 /100 | #185 | Average $99,772 |
| Dutch | 41.7 /100 | #186 | Average $99,650 |
| Iraqis | 38.5 /100 | #187 | Fair $99,387 |
| Immigrants | Portugal | 36.3 /100 | #188 | Fair $99,203 |
| Immigrants | South America | 35.4 /100 | #189 | Fair $99,126 |
| French Canadians | 35.1 /100 | #190 | Fair $99,093 |
| Kenyans | 33.7 /100 | #191 | Fair $98,970 |
| Celtics | 32.9 /100 | #192 | Fair $98,896 |
| Hawaiians | 31.6 /100 | #193 | Fair $98,778 |