Slavic vs Dutch 9th Grade
COMPARE
Slavic
Dutch
9th Grade
9th Grade Comparison
Slavs
Dutch
96.1%
9TH GRADE
99.9/ 100
METRIC RATING
40th/ 347
METRIC RANK
96.5%
9TH GRADE
100.0/ 100
METRIC RATING
17th/ 347
METRIC RANK
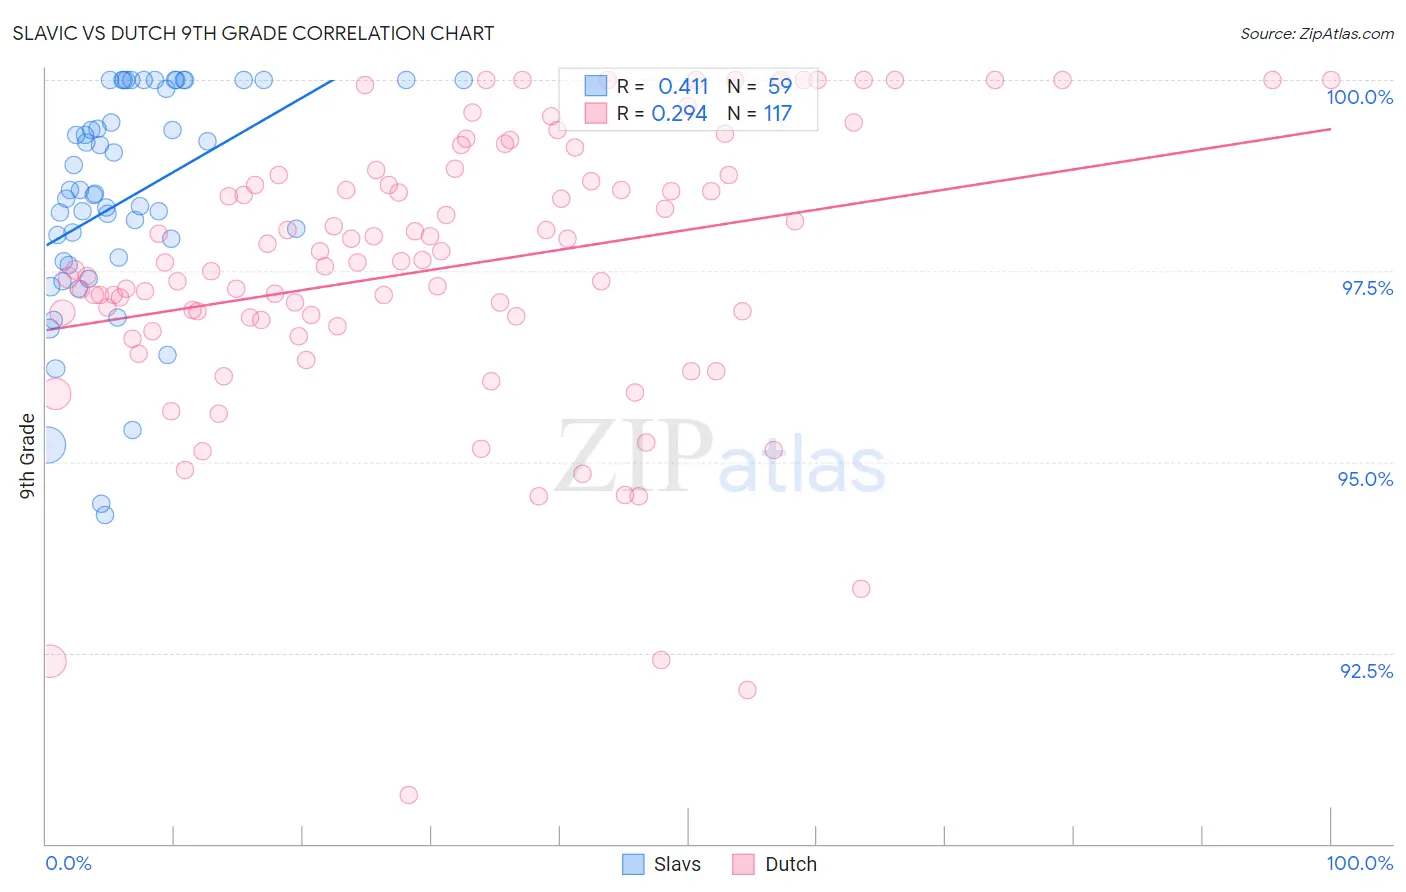
Slavic vs Dutch 9th Grade Correlation Chart
The statistical analysis conducted on geographies consisting of 270,868,354 people shows a moderate positive correlation between the proportion of Slavs and percentage of population with at least 9th grade education in the United States with a correlation coefficient (R) of 0.411 and weighted average of 96.1%. Similarly, the statistical analysis conducted on geographies consisting of 554,359,196 people shows a weak positive correlation between the proportion of Dutch and percentage of population with at least 9th grade education in the United States with a correlation coefficient (R) of 0.294 and weighted average of 96.5%, a difference of 0.37%.
9th Grade Correlation Summary
| Measurement | Slavic | Dutch |
| Minimum | 94.3% | 90.6% |
| Maximum | 100.0% | 100.0% |
| Range | 5.7% | 9.4% |
| Mean | 98.5% | 97.5% |
| Median | 98.5% | 97.6% |
| Interquartile 25% (IQ1) | 97.6% | 96.9% |
| Interquartile 75% (IQ3) | 100.0% | 98.8% |
| Interquartile Range (IQR) | 2.4% | 1.9% |
| Standard Deviation (Sample) | 1.5% | 1.8% |
| Standard Deviation (Population) | 1.4% | 1.8% |
Similar Demographics by 9th Grade
Demographics Similar to Slavs by 9th Grade
In terms of 9th grade, the demographic groups most similar to Slavs are Czechoslovakian (96.1%, a difference of 0.010%), Chippewa (96.1%, a difference of 0.010%), Ottawa (96.1%, a difference of 0.020%), Iranian (96.1%, a difference of 0.020%), and Estonian (96.1%, a difference of 0.040%).
| Demographics | Rating | Rank | 9th Grade |
| Luxembourgers | 100.0 /100 | #33 | Exceptional 96.3% |
| Hungarians | 100.0 /100 | #34 | Exceptional 96.2% |
| Bulgarians | 99.9 /100 | #35 | Exceptional 96.2% |
| Northern Europeans | 99.9 /100 | #36 | Exceptional 96.2% |
| Estonians | 99.9 /100 | #37 | Exceptional 96.1% |
| Immigrants | Scotland | 99.9 /100 | #38 | Exceptional 96.1% |
| Ottawa | 99.9 /100 | #39 | Exceptional 96.1% |
| Slavs | 99.9 /100 | #40 | Exceptional 96.1% |
| Czechoslovakians | 99.9 /100 | #41 | Exceptional 96.1% |
| Chippewa | 99.9 /100 | #42 | Exceptional 96.1% |
| Iranians | 99.9 /100 | #43 | Exceptional 96.1% |
| Alaska Natives | 99.9 /100 | #44 | Exceptional 96.1% |
| Crow | 99.9 /100 | #45 | Exceptional 96.1% |
| Immigrants | India | 99.9 /100 | #46 | Exceptional 96.1% |
| Russians | 99.9 /100 | #47 | Exceptional 96.0% |
Demographics Similar to Dutch by 9th Grade
In terms of 9th grade, the demographic groups most similar to Dutch are Scandinavian (96.5%, a difference of 0.020%), Welsh (96.4%, a difference of 0.050%), Irish (96.5%, a difference of 0.060%), Croatian (96.5%, a difference of 0.060%), and Italian (96.4%, a difference of 0.060%).
| Demographics | Rating | Rank | 9th Grade |
| Lithuanians | 100.0 /100 | #10 | Exceptional 96.6% |
| Finns | 100.0 /100 | #11 | Exceptional 96.6% |
| English | 100.0 /100 | #12 | Exceptional 96.6% |
| Danes | 100.0 /100 | #13 | Exceptional 96.5% |
| Scottish | 100.0 /100 | #14 | Exceptional 96.5% |
| Irish | 100.0 /100 | #15 | Exceptional 96.5% |
| Croatians | 100.0 /100 | #16 | Exceptional 96.5% |
| Dutch | 100.0 /100 | #17 | Exceptional 96.5% |
| Scandinavians | 100.0 /100 | #18 | Exceptional 96.5% |
| Welsh | 100.0 /100 | #19 | Exceptional 96.4% |
| Italians | 100.0 /100 | #20 | Exceptional 96.4% |
| Alaskan Athabascans | 100.0 /100 | #21 | Exceptional 96.4% |
| Europeans | 100.0 /100 | #22 | Exceptional 96.4% |
| Czechs | 100.0 /100 | #23 | Exceptional 96.4% |
| Latvians | 100.0 /100 | #24 | Exceptional 96.4% |