Slavic vs Nonimmigrants Female Poverty
COMPARE
Slavic
Nonimmigrants
Female Poverty
Female Poverty Comparison
Slavs
Nonimmigrants
12.5%
FEMALE POVERTY
94.5/ 100
METRIC RATING
103rd/ 347
METRIC RANK
14.5%
FEMALE POVERTY
3.7/ 100
METRIC RATING
222nd/ 347
METRIC RANK
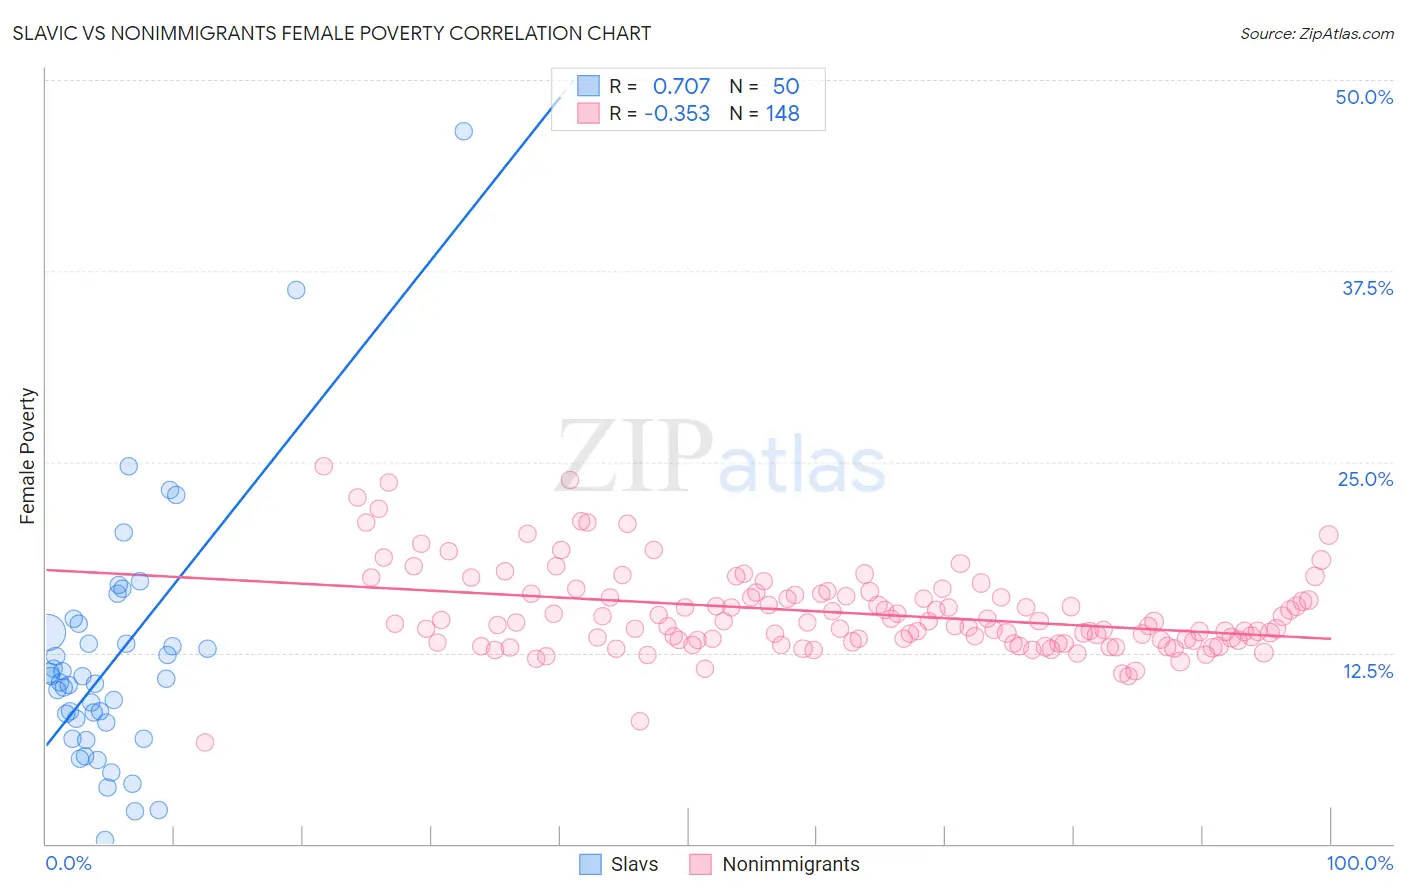
Slavic vs Nonimmigrants Female Poverty Correlation Chart
The statistical analysis conducted on geographies consisting of 270,757,305 people shows a strong positive correlation between the proportion of Slavs and poverty level among females in the United States with a correlation coefficient (R) of 0.707 and weighted average of 12.5%. Similarly, the statistical analysis conducted on geographies consisting of 583,225,965 people shows a mild negative correlation between the proportion of Nonimmigrants and poverty level among females in the United States with a correlation coefficient (R) of -0.353 and weighted average of 14.5%, a difference of 15.8%.
Female Poverty Correlation Summary
| Measurement | Slavic | Nonimmigrants |
| Minimum | 0.21% | 6.7% |
| Maximum | 46.6% | 24.7% |
| Range | 46.4% | 18.0% |
| Mean | 12.0% | 15.1% |
| Median | 10.7% | 14.4% |
| Interquartile 25% (IQ1) | 7.9% | 13.3% |
| Interquartile 75% (IQ3) | 13.8% | 16.3% |
| Interquartile Range (IQR) | 5.9% | 3.0% |
| Standard Deviation (Sample) | 8.1% | 2.8% |
| Standard Deviation (Population) | 8.0% | 2.8% |
Similar Demographics by Female Poverty
Demographics Similar to Slavs by Female Poverty
In terms of female poverty, the demographic groups most similar to Slavs are Immigrants from China (12.5%, a difference of 0.020%), Palestinian (12.5%, a difference of 0.090%), Immigrants from Latvia (12.5%, a difference of 0.17%), Tlingit-Haida (12.5%, a difference of 0.17%), and Scottish (12.5%, a difference of 0.20%).
| Demographics | Rating | Rank | Female Poverty |
| British | 95.2 /100 | #96 | Exceptional 12.5% |
| Australians | 95.2 /100 | #97 | Exceptional 12.5% |
| Native Hawaiians | 95.1 /100 | #98 | Exceptional 12.5% |
| Romanians | 95.1 /100 | #99 | Exceptional 12.5% |
| Immigrants | Latvia | 94.8 /100 | #100 | Exceptional 12.5% |
| Tlingit-Haida | 94.8 /100 | #101 | Exceptional 12.5% |
| Immigrants | China | 94.5 /100 | #102 | Exceptional 12.5% |
| Slavs | 94.5 /100 | #103 | Exceptional 12.5% |
| Palestinians | 94.3 /100 | #104 | Exceptional 12.5% |
| Scottish | 94.1 /100 | #105 | Exceptional 12.5% |
| Immigrants | Turkey | 93.8 /100 | #106 | Exceptional 12.6% |
| Laotians | 93.4 /100 | #107 | Exceptional 12.6% |
| Portuguese | 93.1 /100 | #108 | Exceptional 12.6% |
| Immigrants | Zimbabwe | 93.1 /100 | #109 | Exceptional 12.6% |
| Paraguayans | 93.0 /100 | #110 | Exceptional 12.6% |
Demographics Similar to Nonimmigrants by Female Poverty
In terms of female poverty, the demographic groups most similar to Nonimmigrants are Immigrants from Cambodia (14.5%, a difference of 0.020%), Alsatian (14.5%, a difference of 0.22%), Immigrants from Africa (14.5%, a difference of 0.23%), Japanese (14.5%, a difference of 0.26%), and Immigrants from Uzbekistan (14.4%, a difference of 0.40%).
| Demographics | Rating | Rank | Female Poverty |
| Immigrants | Panama | 4.7 /100 | #215 | Tragic 14.4% |
| Immigrants | Thailand | 4.5 /100 | #216 | Tragic 14.4% |
| Immigrants | Immigrants | 4.5 /100 | #217 | Tragic 14.4% |
| Immigrants | Uzbekistan | 4.4 /100 | #218 | Tragic 14.4% |
| Japanese | 4.1 /100 | #219 | Tragic 14.5% |
| Alsatians | 4.0 /100 | #220 | Tragic 14.5% |
| Immigrants | Cambodia | 3.7 /100 | #221 | Tragic 14.5% |
| Immigrants | Nonimmigrants | 3.7 /100 | #222 | Tragic 14.5% |
| Immigrants | Africa | 3.3 /100 | #223 | Tragic 14.5% |
| Americans | 2.8 /100 | #224 | Tragic 14.6% |
| Immigrants | Micronesia | 2.8 /100 | #225 | Tragic 14.6% |
| Immigrants | Eritrea | 2.4 /100 | #226 | Tragic 14.6% |
| Immigrants | Nigeria | 2.1 /100 | #227 | Tragic 14.7% |
| German Russians | 2.0 /100 | #228 | Tragic 14.7% |
| Ghanaians | 1.9 /100 | #229 | Tragic 14.7% |