Sioux vs Latvian Single Mother Poverty
COMPARE
Sioux
Latvian
Single Mother Poverty
Single Mother Poverty Comparison
Sioux
Latvians
38.8%
SINGLE MOTHER POVERTY
0.0/ 100
METRIC RATING
340th/ 347
METRIC RANK
26.9%
SINGLE MOTHER POVERTY
99.9/ 100
METRIC RATING
45th/ 347
METRIC RANK
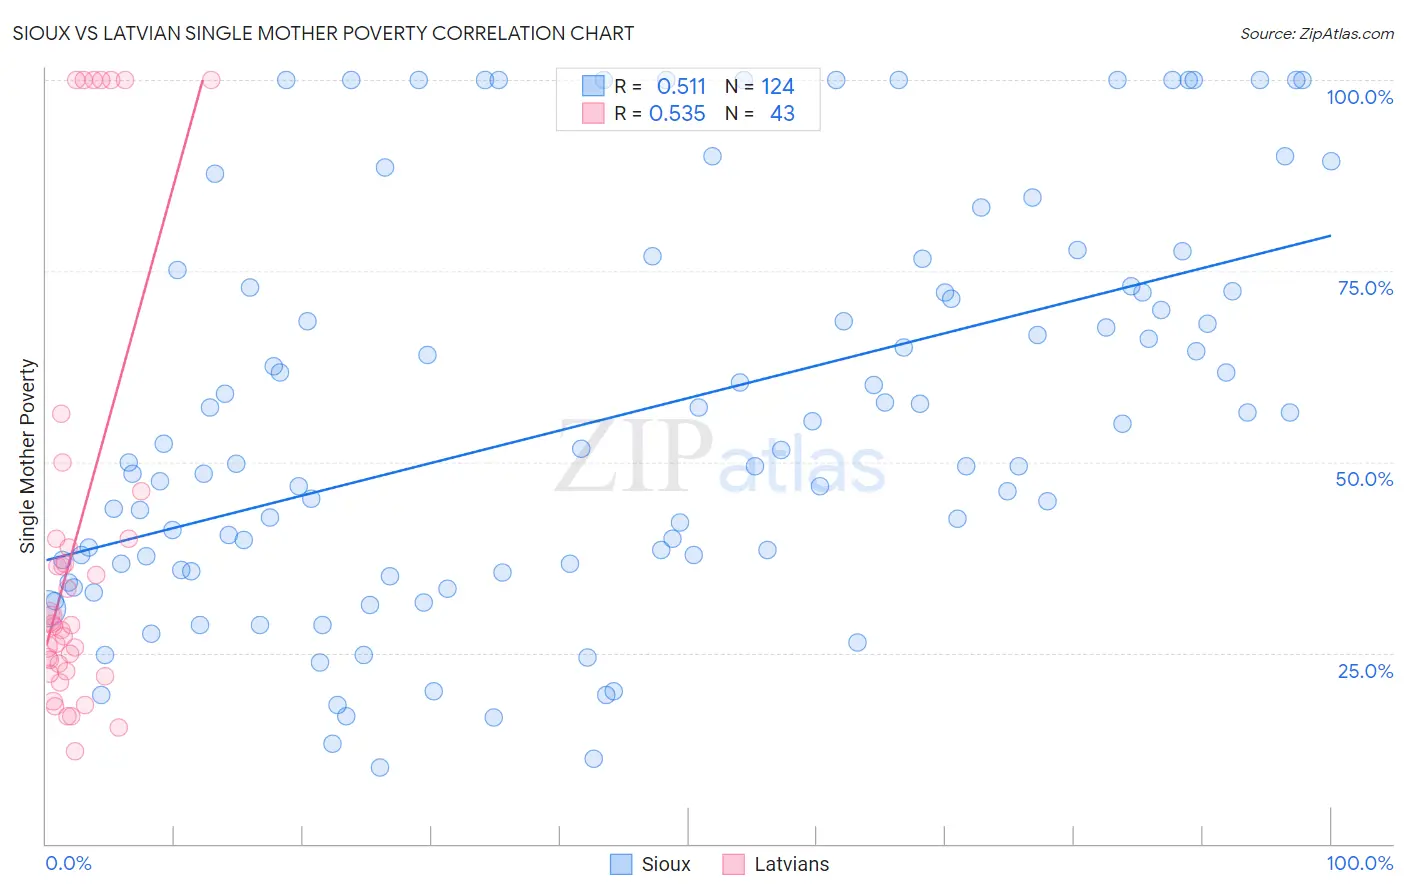
Sioux vs Latvian Single Mother Poverty Correlation Chart
The statistical analysis conducted on geographies consisting of 231,213,938 people shows a substantial positive correlation between the proportion of Sioux and poverty level among single mothers in the United States with a correlation coefficient (R) of 0.511 and weighted average of 38.8%. Similarly, the statistical analysis conducted on geographies consisting of 216,142,083 people shows a substantial positive correlation between the proportion of Latvians and poverty level among single mothers in the United States with a correlation coefficient (R) of 0.535 and weighted average of 26.9%, a difference of 44.3%.
Single Mother Poverty Correlation Summary
| Measurement | Sioux | Latvian |
| Minimum | 10.0% | 12.0% |
| Maximum | 100.0% | 100.0% |
| Range | 90.0% | 88.0% |
| Mean | 55.8% | 40.2% |
| Median | 50.7% | 28.6% |
| Interquartile 25% (IQ1) | 36.2% | 22.6% |
| Interquartile 75% (IQ3) | 72.6% | 40.0% |
| Interquartile Range (IQR) | 36.4% | 17.4% |
| Standard Deviation (Sample) | 25.6% | 28.2% |
| Standard Deviation (Population) | 25.5% | 27.9% |
Similar Demographics by Single Mother Poverty
Demographics Similar to Sioux by Single Mother Poverty
In terms of single mother poverty, the demographic groups most similar to Sioux are Crow (38.6%, a difference of 0.40%), Pima (38.6%, a difference of 0.49%), Immigrants from Yemen (38.5%, a difference of 0.70%), Cheyenne (38.5%, a difference of 0.74%), and Colville (39.3%, a difference of 1.3%).
| Demographics | Rating | Rank | Single Mother Poverty |
| Menominee | 0.0 /100 | #333 | Tragic 37.1% |
| Pueblo | 0.0 /100 | #334 | Tragic 37.2% |
| Yuman | 0.0 /100 | #335 | Tragic 37.8% |
| Cheyenne | 0.0 /100 | #336 | Tragic 38.5% |
| Immigrants | Yemen | 0.0 /100 | #337 | Tragic 38.5% |
| Pima | 0.0 /100 | #338 | Tragic 38.6% |
| Crow | 0.0 /100 | #339 | Tragic 38.6% |
| Sioux | 0.0 /100 | #340 | Tragic 38.8% |
| Colville | 0.0 /100 | #341 | Tragic 39.3% |
| Navajo | 0.0 /100 | #342 | Tragic 40.2% |
| Cajuns | 0.0 /100 | #343 | Tragic 40.3% |
| Tohono O'odham | 0.0 /100 | #344 | Tragic 43.0% |
| Lumbee | 0.0 /100 | #345 | Tragic 43.2% |
| Houma | 0.0 /100 | #346 | Tragic 43.5% |
| Puerto Ricans | 0.0 /100 | #347 | Tragic 44.5% |
Demographics Similar to Latvians by Single Mother Poverty
In terms of single mother poverty, the demographic groups most similar to Latvians are Immigrants from Serbia (26.9%, a difference of 0.040%), Immigrants from Sierra Leone (26.9%, a difference of 0.070%), Egyptian (26.9%, a difference of 0.10%), Immigrants from Poland (26.9%, a difference of 0.18%), and Tsimshian (26.8%, a difference of 0.21%).
| Demographics | Rating | Rank | Single Mother Poverty |
| Immigrants | Fiji | 99.9 /100 | #38 | Exceptional 26.6% |
| Sri Lankans | 99.9 /100 | #39 | Exceptional 26.7% |
| Immigrants | Vietnam | 99.9 /100 | #40 | Exceptional 26.7% |
| Immigrants | Greece | 99.9 /100 | #41 | Exceptional 26.7% |
| Armenians | 99.9 /100 | #42 | Exceptional 26.8% |
| Tsimshian | 99.9 /100 | #43 | Exceptional 26.8% |
| Immigrants | Sierra Leone | 99.9 /100 | #44 | Exceptional 26.9% |
| Latvians | 99.9 /100 | #45 | Exceptional 26.9% |
| Immigrants | Serbia | 99.9 /100 | #46 | Exceptional 26.9% |
| Egyptians | 99.8 /100 | #47 | Exceptional 26.9% |
| Immigrants | Poland | 99.8 /100 | #48 | Exceptional 26.9% |
| Cambodians | 99.8 /100 | #49 | Exceptional 27.0% |
| Laotians | 99.8 /100 | #50 | Exceptional 27.0% |
| Immigrants | Argentina | 99.7 /100 | #51 | Exceptional 27.1% |
| Immigrants | South Eastern Asia | 99.7 /100 | #52 | Exceptional 27.1% |