Sioux vs Soviet Union Professional Degree
COMPARE
Sioux
Soviet Union
Professional Degree
Professional Degree Comparison
Sioux
Soviet Union
3.3%
PROFESSIONAL DEGREE
0.1/ 100
METRIC RATING
312th/ 347
METRIC RANK
6.6%
PROFESSIONAL DEGREE
100.0/ 100
METRIC RATING
18th/ 347
METRIC RANK
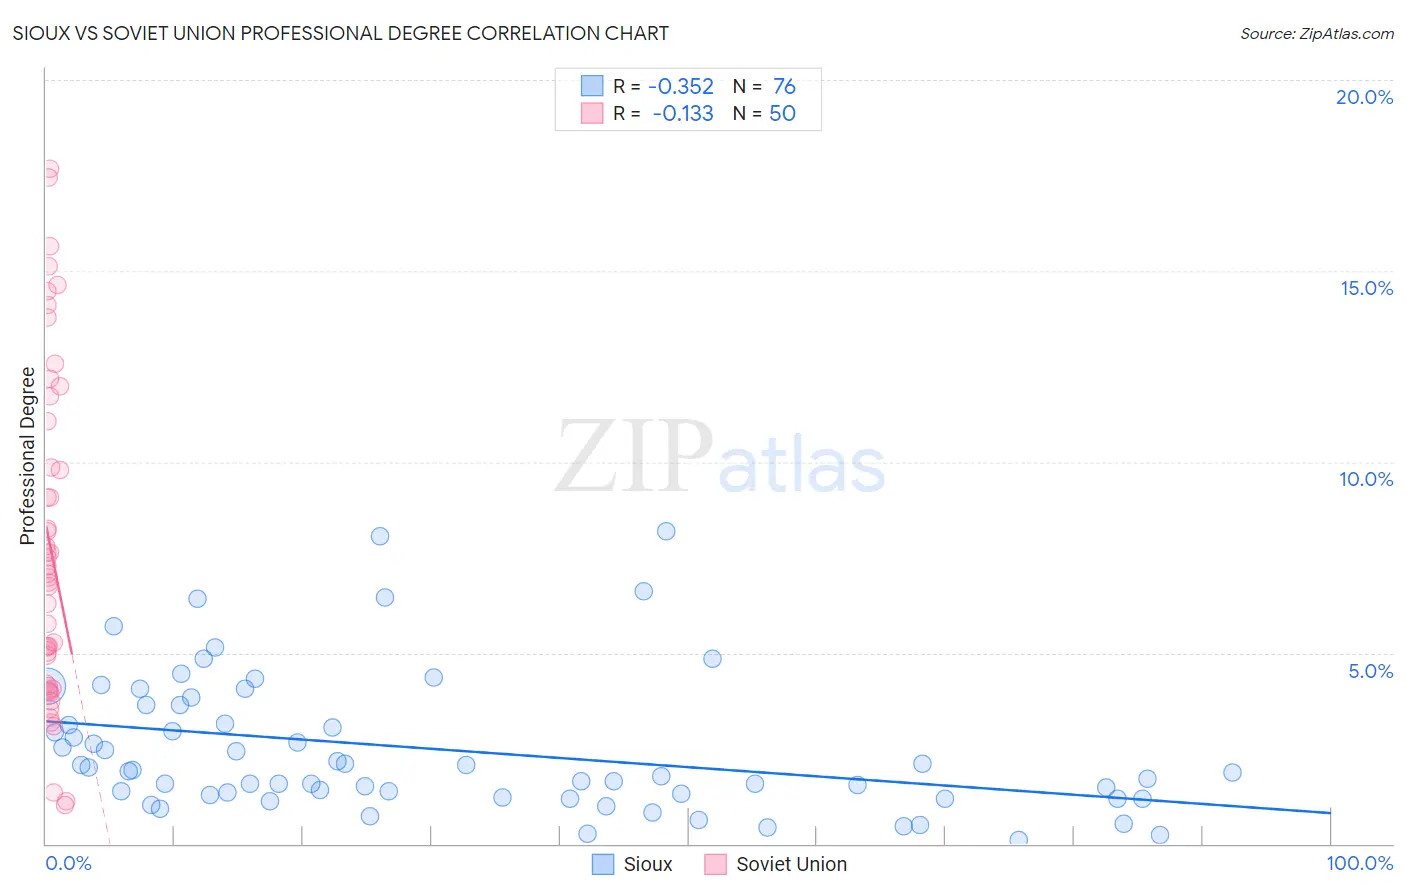
Sioux vs Soviet Union Professional Degree Correlation Chart
The statistical analysis conducted on geographies consisting of 233,329,443 people shows a mild negative correlation between the proportion of Sioux and percentage of population with at least professional degree education in the United States with a correlation coefficient (R) of -0.352 and weighted average of 3.3%. Similarly, the statistical analysis conducted on geographies consisting of 43,509,630 people shows a poor negative correlation between the proportion of Soviet Union and percentage of population with at least professional degree education in the United States with a correlation coefficient (R) of -0.133 and weighted average of 6.6%, a difference of 100.5%.
Professional Degree Correlation Summary
| Measurement | Sioux | Soviet Union |
| Minimum | 0.086% | 1.0% |
| Maximum | 8.2% | 17.7% |
| Range | 8.1% | 16.7% |
| Mean | 2.5% | 7.8% |
| Median | 1.9% | 7.0% |
| Interquartile 25% (IQ1) | 1.2% | 4.1% |
| Interquartile 75% (IQ3) | 3.4% | 11.1% |
| Interquartile Range (IQR) | 2.1% | 6.9% |
| Standard Deviation (Sample) | 1.8% | 4.4% |
| Standard Deviation (Population) | 1.8% | 4.3% |
Similar Demographics by Professional Degree
Demographics Similar to Sioux by Professional Degree
In terms of professional degree, the demographic groups most similar to Sioux are Yuman (3.3%, a difference of 0.010%), Mexican American Indian (3.3%, a difference of 0.23%), Cherokee (3.3%, a difference of 0.59%), Immigrants from Latin America (3.3%, a difference of 0.75%), and Immigrants from Laos (3.2%, a difference of 0.91%).
| Demographics | Rating | Rank | Professional Degree |
| Chickasaw | 0.1 /100 | #305 | Tragic 3.4% |
| Cape Verdeans | 0.1 /100 | #306 | Tragic 3.4% |
| Samoans | 0.1 /100 | #307 | Tragic 3.3% |
| Shoshone | 0.1 /100 | #308 | Tragic 3.3% |
| Pima | 0.1 /100 | #309 | Tragic 3.3% |
| Immigrants | Latin America | 0.1 /100 | #310 | Tragic 3.3% |
| Cherokee | 0.1 /100 | #311 | Tragic 3.3% |
| Sioux | 0.1 /100 | #312 | Tragic 3.3% |
| Yuman | 0.1 /100 | #313 | Tragic 3.3% |
| Mexican American Indians | 0.1 /100 | #314 | Tragic 3.3% |
| Immigrants | Laos | 0.1 /100 | #315 | Tragic 3.2% |
| Puerto Ricans | 0.1 /100 | #316 | Tragic 3.2% |
| Nepalese | 0.1 /100 | #317 | Tragic 3.2% |
| Immigrants | Micronesia | 0.1 /100 | #318 | Tragic 3.2% |
| Choctaw | 0.1 /100 | #319 | Tragic 3.2% |
Demographics Similar to Soviet Union by Professional Degree
In terms of professional degree, the demographic groups most similar to Soviet Union are Immigrants from Eastern Asia (6.6%, a difference of 0.020%), Indian (Asian) (6.5%, a difference of 0.66%), Immigrants from Sweden (6.7%, a difference of 2.0%), Immigrants from Denmark (6.4%, a difference of 2.2%), and Immigrants from Hong Kong (6.4%, a difference of 2.4%).
| Demographics | Rating | Rank | Professional Degree |
| Cypriots | 100.0 /100 | #11 | Exceptional 6.9% |
| Israelis | 100.0 /100 | #12 | Exceptional 6.9% |
| Immigrants | Australia | 100.0 /100 | #13 | Exceptional 6.9% |
| Immigrants | France | 100.0 /100 | #14 | Exceptional 6.8% |
| Immigrants | China | 100.0 /100 | #15 | Exceptional 6.7% |
| Immigrants | Sweden | 100.0 /100 | #16 | Exceptional 6.7% |
| Immigrants | Eastern Asia | 100.0 /100 | #17 | Exceptional 6.6% |
| Soviet Union | 100.0 /100 | #18 | Exceptional 6.6% |
| Indians (Asian) | 100.0 /100 | #19 | Exceptional 6.5% |
| Immigrants | Denmark | 100.0 /100 | #20 | Exceptional 6.4% |
| Immigrants | Hong Kong | 100.0 /100 | #21 | Exceptional 6.4% |
| Immigrants | Japan | 100.0 /100 | #22 | Exceptional 6.4% |
| Russians | 100.0 /100 | #23 | Exceptional 6.3% |
| Immigrants | Spain | 100.0 /100 | #24 | Exceptional 6.3% |
| Immigrants | Ireland | 100.0 /100 | #25 | Exceptional 6.3% |