Sioux vs Vietnamese Single Mother Poverty
COMPARE
Sioux
Vietnamese
Single Mother Poverty
Single Mother Poverty Comparison
Sioux
Vietnamese
38.8%
SINGLE MOTHER POVERTY
0.0/ 100
METRIC RATING
340th/ 347
METRIC RANK
30.9%
SINGLE MOTHER POVERTY
0.7/ 100
METRIC RATING
250th/ 347
METRIC RANK
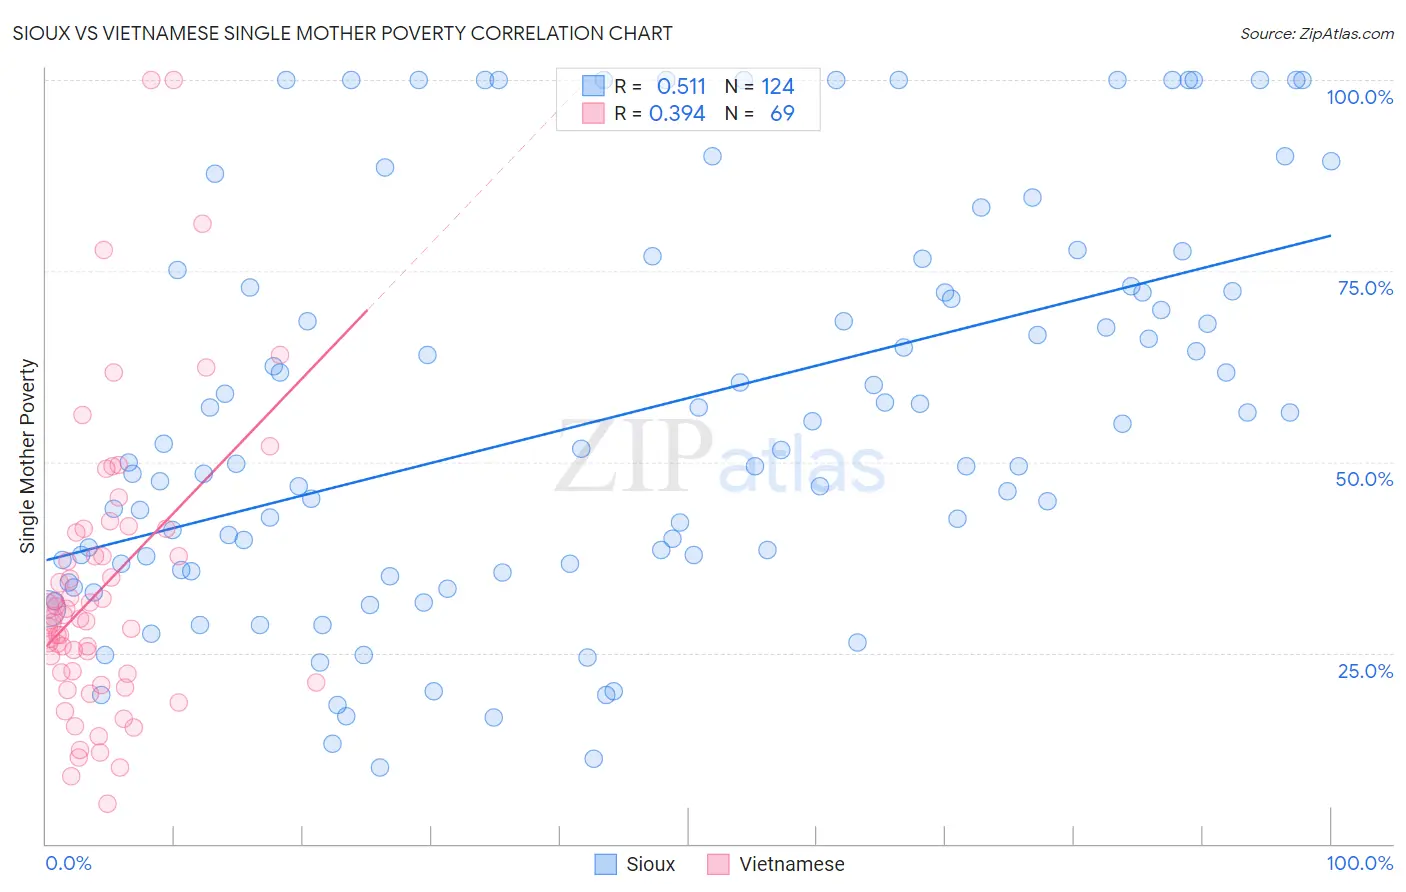
Sioux vs Vietnamese Single Mother Poverty Correlation Chart
The statistical analysis conducted on geographies consisting of 231,213,938 people shows a substantial positive correlation between the proportion of Sioux and poverty level among single mothers in the United States with a correlation coefficient (R) of 0.511 and weighted average of 38.8%. Similarly, the statistical analysis conducted on geographies consisting of 168,932,056 people shows a mild positive correlation between the proportion of Vietnamese and poverty level among single mothers in the United States with a correlation coefficient (R) of 0.394 and weighted average of 30.9%, a difference of 25.6%.
Single Mother Poverty Correlation Summary
| Measurement | Sioux | Vietnamese |
| Minimum | 10.0% | 5.3% |
| Maximum | 100.0% | 100.0% |
| Range | 90.0% | 94.7% |
| Mean | 55.8% | 33.6% |
| Median | 50.7% | 29.4% |
| Interquartile 25% (IQ1) | 36.2% | 21.7% |
| Interquartile 75% (IQ3) | 72.6% | 41.0% |
| Interquartile Range (IQR) | 36.4% | 19.2% |
| Standard Deviation (Sample) | 25.6% | 19.1% |
| Standard Deviation (Population) | 25.5% | 19.0% |
Similar Demographics by Single Mother Poverty
Demographics Similar to Sioux by Single Mother Poverty
In terms of single mother poverty, the demographic groups most similar to Sioux are Crow (38.6%, a difference of 0.40%), Pima (38.6%, a difference of 0.49%), Immigrants from Yemen (38.5%, a difference of 0.70%), Cheyenne (38.5%, a difference of 0.74%), and Colville (39.3%, a difference of 1.3%).
| Demographics | Rating | Rank | Single Mother Poverty |
| Menominee | 0.0 /100 | #333 | Tragic 37.1% |
| Pueblo | 0.0 /100 | #334 | Tragic 37.2% |
| Yuman | 0.0 /100 | #335 | Tragic 37.8% |
| Cheyenne | 0.0 /100 | #336 | Tragic 38.5% |
| Immigrants | Yemen | 0.0 /100 | #337 | Tragic 38.5% |
| Pima | 0.0 /100 | #338 | Tragic 38.6% |
| Crow | 0.0 /100 | #339 | Tragic 38.6% |
| Sioux | 0.0 /100 | #340 | Tragic 38.8% |
| Colville | 0.0 /100 | #341 | Tragic 39.3% |
| Navajo | 0.0 /100 | #342 | Tragic 40.2% |
| Cajuns | 0.0 /100 | #343 | Tragic 40.3% |
| Tohono O'odham | 0.0 /100 | #344 | Tragic 43.0% |
| Lumbee | 0.0 /100 | #345 | Tragic 43.2% |
| Houma | 0.0 /100 | #346 | Tragic 43.5% |
| Puerto Ricans | 0.0 /100 | #347 | Tragic 44.5% |
Demographics Similar to Vietnamese by Single Mother Poverty
In terms of single mother poverty, the demographic groups most similar to Vietnamese are Tlingit-Haida (30.9%, a difference of 0.12%), Alaska Native (30.9%, a difference of 0.13%), Cape Verdean (30.8%, a difference of 0.15%), Celtic (30.9%, a difference of 0.16%), and French Canadian (30.8%, a difference of 0.22%).
| Demographics | Rating | Rank | Single Mother Poverty |
| Bermudans | 1.6 /100 | #243 | Tragic 30.6% |
| French | 1.3 /100 | #244 | Tragic 30.7% |
| Barbadians | 1.3 /100 | #245 | Tragic 30.7% |
| Ecuadorians | 0.9 /100 | #246 | Tragic 30.8% |
| West Indians | 0.9 /100 | #247 | Tragic 30.8% |
| French Canadians | 0.9 /100 | #248 | Tragic 30.8% |
| Cape Verdeans | 0.8 /100 | #249 | Tragic 30.8% |
| Vietnamese | 0.7 /100 | #250 | Tragic 30.9% |
| Tlingit-Haida | 0.6 /100 | #251 | Tragic 30.9% |
| Alaska Natives | 0.6 /100 | #252 | Tragic 30.9% |
| Celtics | 0.6 /100 | #253 | Tragic 30.9% |
| Senegalese | 0.5 /100 | #254 | Tragic 31.0% |
| Belizeans | 0.5 /100 | #255 | Tragic 31.0% |
| Immigrants | West Indies | 0.4 /100 | #256 | Tragic 31.1% |
| Immigrants | Bahamas | 0.4 /100 | #257 | Tragic 31.1% |