Shoshone vs French Single Female Poverty
COMPARE
Shoshone
French
Single Female Poverty
Single Female Poverty Comparison
Shoshone
French
25.1%
SINGLE FEMALE POVERTY
0.0/ 100
METRIC RATING
302nd/ 347
METRIC RANK
22.2%
SINGLE FEMALE POVERTY
2.3/ 100
METRIC RATING
240th/ 347
METRIC RANK
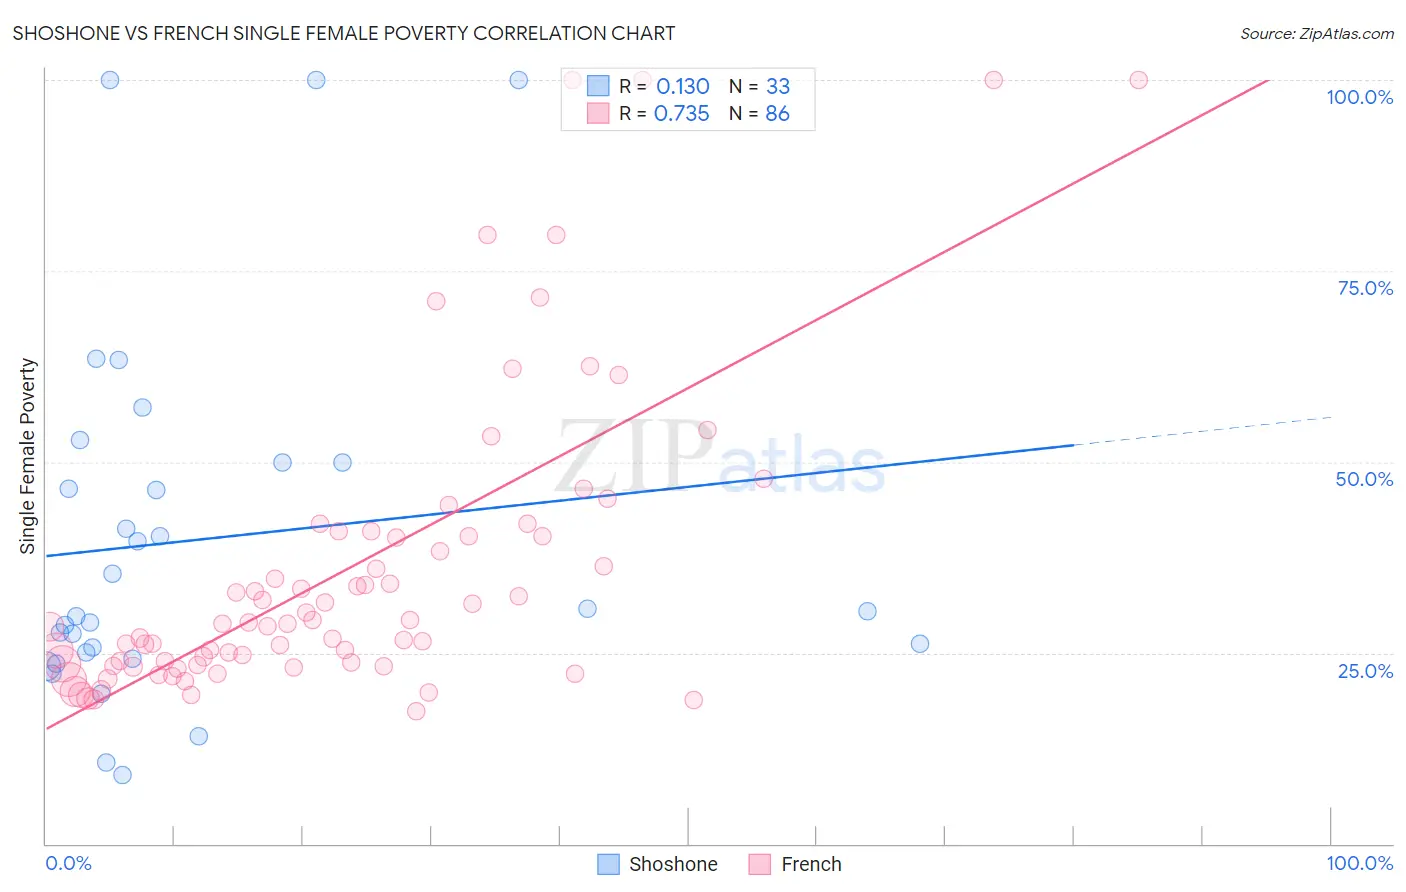
Shoshone vs French Single Female Poverty Correlation Chart
The statistical analysis conducted on geographies consisting of 66,449,019 people shows a poor positive correlation between the proportion of Shoshone and poverty level among single females in the United States with a correlation coefficient (R) of 0.130 and weighted average of 25.1%. Similarly, the statistical analysis conducted on geographies consisting of 551,878,026 people shows a strong positive correlation between the proportion of French and poverty level among single females in the United States with a correlation coefficient (R) of 0.735 and weighted average of 22.2%, a difference of 13.0%.
Single Female Poverty Correlation Summary
| Measurement | Shoshone | French |
| Minimum | 9.1% | 17.3% |
| Maximum | 100.0% | 100.0% |
| Range | 90.9% | 82.7% |
| Mean | 39.8% | 36.0% |
| Median | 30.4% | 28.8% |
| Interquartile 25% (IQ1) | 24.6% | 23.4% |
| Interquartile 75% (IQ3) | 50.0% | 40.3% |
| Interquartile Range (IQR) | 25.4% | 17.0% |
| Standard Deviation (Sample) | 23.8% | 19.8% |
| Standard Deviation (Population) | 23.4% | 19.7% |
Similar Demographics by Single Female Poverty
Demographics Similar to Shoshone by Single Female Poverty
In terms of single female poverty, the demographic groups most similar to Shoshone are Honduran (25.1%, a difference of 0.090%), Blackfeet (25.1%, a difference of 0.26%), Mexican (25.0%, a difference of 0.34%), Somali (25.2%, a difference of 0.40%), and Immigrants from Congo (25.3%, a difference of 0.66%).
| Demographics | Rating | Rank | Single Female Poverty |
| Hispanics or Latinos | 0.0 /100 | #295 | Tragic 24.6% |
| Africans | 0.0 /100 | #296 | Tragic 24.8% |
| Immigrants | Central America | 0.0 /100 | #297 | Tragic 24.8% |
| Yaqui | 0.0 /100 | #298 | Tragic 24.9% |
| Mexicans | 0.0 /100 | #299 | Tragic 25.0% |
| Blackfeet | 0.0 /100 | #300 | Tragic 25.1% |
| Hondurans | 0.0 /100 | #301 | Tragic 25.1% |
| Shoshone | 0.0 /100 | #302 | Tragic 25.1% |
| Somalis | 0.0 /100 | #303 | Tragic 25.2% |
| Immigrants | Congo | 0.0 /100 | #304 | Tragic 25.3% |
| Immigrants | Dominican Republic | 0.0 /100 | #305 | Tragic 25.3% |
| Immigrants | Mexico | 0.0 /100 | #306 | Tragic 25.3% |
| Potawatomi | 0.0 /100 | #307 | Tragic 25.4% |
| Aleuts | 0.0 /100 | #308 | Tragic 25.4% |
| Dominicans | 0.0 /100 | #309 | Tragic 25.4% |
Demographics Similar to French by Single Female Poverty
In terms of single female poverty, the demographic groups most similar to French are Cape Verdean (22.3%, a difference of 0.14%), Bermudan (22.3%, a difference of 0.21%), Malaysian (22.2%, a difference of 0.26%), French Canadian (22.2%, a difference of 0.27%), and West Indian (22.3%, a difference of 0.30%).
| Demographics | Rating | Rank | Single Female Poverty |
| Spaniards | 4.7 /100 | #233 | Tragic 22.0% |
| Spanish | 4.7 /100 | #234 | Tragic 22.0% |
| Dutch | 4.6 /100 | #235 | Tragic 22.0% |
| Immigrants | Ecuador | 4.2 /100 | #236 | Tragic 22.0% |
| Vietnamese | 4.0 /100 | #237 | Tragic 22.0% |
| French Canadians | 2.8 /100 | #238 | Tragic 22.2% |
| Malaysians | 2.8 /100 | #239 | Tragic 22.2% |
| French | 2.3 /100 | #240 | Tragic 22.2% |
| Cape Verdeans | 2.1 /100 | #241 | Tragic 22.3% |
| Bermudans | 2.0 /100 | #242 | Tragic 22.3% |
| West Indians | 1.9 /100 | #243 | Tragic 22.3% |
| Immigrants | Middle Africa | 1.9 /100 | #244 | Tragic 22.3% |
| Immigrants | Bangladesh | 1.8 /100 | #245 | Tragic 22.3% |
| Liberians | 1.4 /100 | #246 | Tragic 22.4% |
| Immigrants | El Salvador | 1.4 /100 | #247 | Tragic 22.4% |