German Russian vs Immigrants from Cuba Single Female Poverty
COMPARE
German Russian
Immigrants from Cuba
Single Female Poverty
Single Female Poverty Comparison
German Russians
Immigrants from Cuba
23.9%
SINGLE FEMALE POVERTY
0.0/ 100
METRIC RATING
283rd/ 347
METRIC RANK
21.2%
SINGLE FEMALE POVERTY
35.3/ 100
METRIC RATING
189th/ 347
METRIC RANK
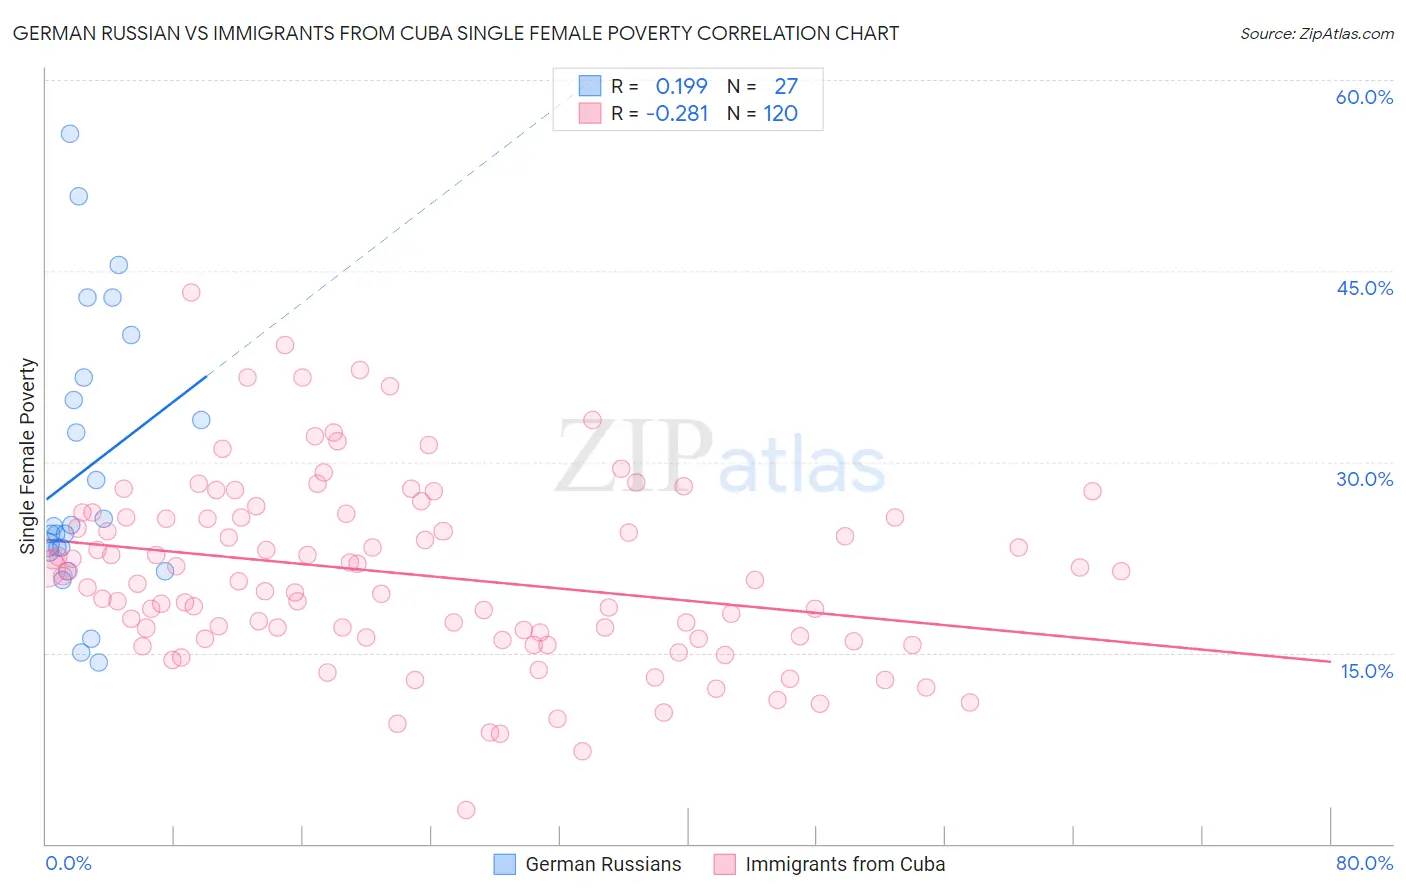
German Russian vs Immigrants from Cuba Single Female Poverty Correlation Chart
The statistical analysis conducted on geographies consisting of 96,093,035 people shows a poor positive correlation between the proportion of German Russians and poverty level among single females in the United States with a correlation coefficient (R) of 0.199 and weighted average of 23.9%. Similarly, the statistical analysis conducted on geographies consisting of 322,497,975 people shows a weak negative correlation between the proportion of Immigrants from Cuba and poverty level among single females in the United States with a correlation coefficient (R) of -0.281 and weighted average of 21.2%, a difference of 12.6%.
Single Female Poverty Correlation Summary
| Measurement | German Russian | Immigrants from Cuba |
| Minimum | 14.3% | 2.6% |
| Maximum | 55.7% | 43.3% |
| Range | 41.4% | 40.7% |
| Mean | 29.4% | 21.1% |
| Median | 25.0% | 20.7% |
| Interquartile 25% (IQ1) | 22.9% | 16.2% |
| Interquartile 75% (IQ3) | 36.6% | 25.7% |
| Interquartile Range (IQR) | 13.7% | 9.5% |
| Standard Deviation (Sample) | 10.9% | 7.2% |
| Standard Deviation (Population) | 10.7% | 7.2% |
Similar Demographics by Single Female Poverty
Demographics Similar to German Russians by Single Female Poverty
In terms of single female poverty, the demographic groups most similar to German Russians are Immigrants from Dominica (23.9%, a difference of 0.11%), Guatemalan (23.8%, a difference of 0.14%), Immigrants from Zaire (23.8%, a difference of 0.20%), Immigrants from Latin America (23.7%, a difference of 0.71%), and Immigrants from Guatemala (24.1%, a difference of 0.97%).
| Demographics | Rating | Rank | Single Female Poverty |
| Immigrants | Azores | 0.0 /100 | #276 | Tragic 23.5% |
| Pennsylvania Germans | 0.0 /100 | #277 | Tragic 23.6% |
| Immigrants | Nonimmigrants | 0.0 /100 | #278 | Tragic 23.6% |
| Alaskan Athabascans | 0.0 /100 | #279 | Tragic 23.6% |
| Immigrants | Latin America | 0.0 /100 | #280 | Tragic 23.7% |
| Immigrants | Zaire | 0.0 /100 | #281 | Tragic 23.8% |
| Guatemalans | 0.0 /100 | #282 | Tragic 23.8% |
| German Russians | 0.0 /100 | #283 | Tragic 23.9% |
| Immigrants | Dominica | 0.0 /100 | #284 | Tragic 23.9% |
| Immigrants | Guatemala | 0.0 /100 | #285 | Tragic 24.1% |
| Cree | 0.0 /100 | #286 | Tragic 24.1% |
| Bangladeshis | 0.0 /100 | #287 | Tragic 24.2% |
| Spanish Americans | 0.0 /100 | #288 | Tragic 24.2% |
| U.S. Virgin Islanders | 0.0 /100 | #289 | Tragic 24.2% |
| Indonesians | 0.0 /100 | #290 | Tragic 24.3% |
Demographics Similar to Immigrants from Cuba by Single Female Poverty
In terms of single female poverty, the demographic groups most similar to Immigrants from Cuba are Trinidadian and Tobagonian (21.2%, a difference of 0.0%), Yugoslavian (21.2%, a difference of 0.010%), Immigrants from Nigeria (21.2%, a difference of 0.10%), Hawaiian (21.2%, a difference of 0.16%), and Immigrants from Cambodia (21.2%, a difference of 0.20%).
| Demographics | Rating | Rank | Single Female Poverty |
| Slavs | 40.5 /100 | #182 | Average 21.1% |
| Slovaks | 39.7 /100 | #183 | Fair 21.1% |
| Hungarians | 39.6 /100 | #184 | Fair 21.1% |
| Immigrants | Cambodia | 38.2 /100 | #185 | Fair 21.2% |
| Hawaiians | 37.7 /100 | #186 | Fair 21.2% |
| Immigrants | Nigeria | 36.8 /100 | #187 | Fair 21.2% |
| Yugoslavians | 35.4 /100 | #188 | Fair 21.2% |
| Immigrants | Cuba | 35.3 /100 | #189 | Fair 21.2% |
| Trinidadians and Tobagonians | 35.2 /100 | #190 | Fair 21.2% |
| Immigrants | Germany | 31.1 /100 | #191 | Fair 21.3% |
| Immigrants | Jamaica | 30.5 /100 | #192 | Fair 21.3% |
| Basques | 28.1 /100 | #193 | Fair 21.3% |
| Czechoslovakians | 27.7 /100 | #194 | Fair 21.3% |
| Nicaraguans | 27.6 /100 | #195 | Fair 21.3% |
| Immigrants | Saudi Arabia | 27.1 /100 | #196 | Fair 21.3% |