Serbian vs Immigrants from Cuba Family Households
COMPARE
Serbian
Immigrants from Cuba
Family Households
Family Households Comparison
Serbians
Immigrants from Cuba
63.0%
FAMILY HOUSEHOLDS
0.3/ 100
METRIC RATING
276th/ 347
METRIC RANK
68.2%
FAMILY HOUSEHOLDS
100.0/ 100
METRIC RATING
14th/ 347
METRIC RANK
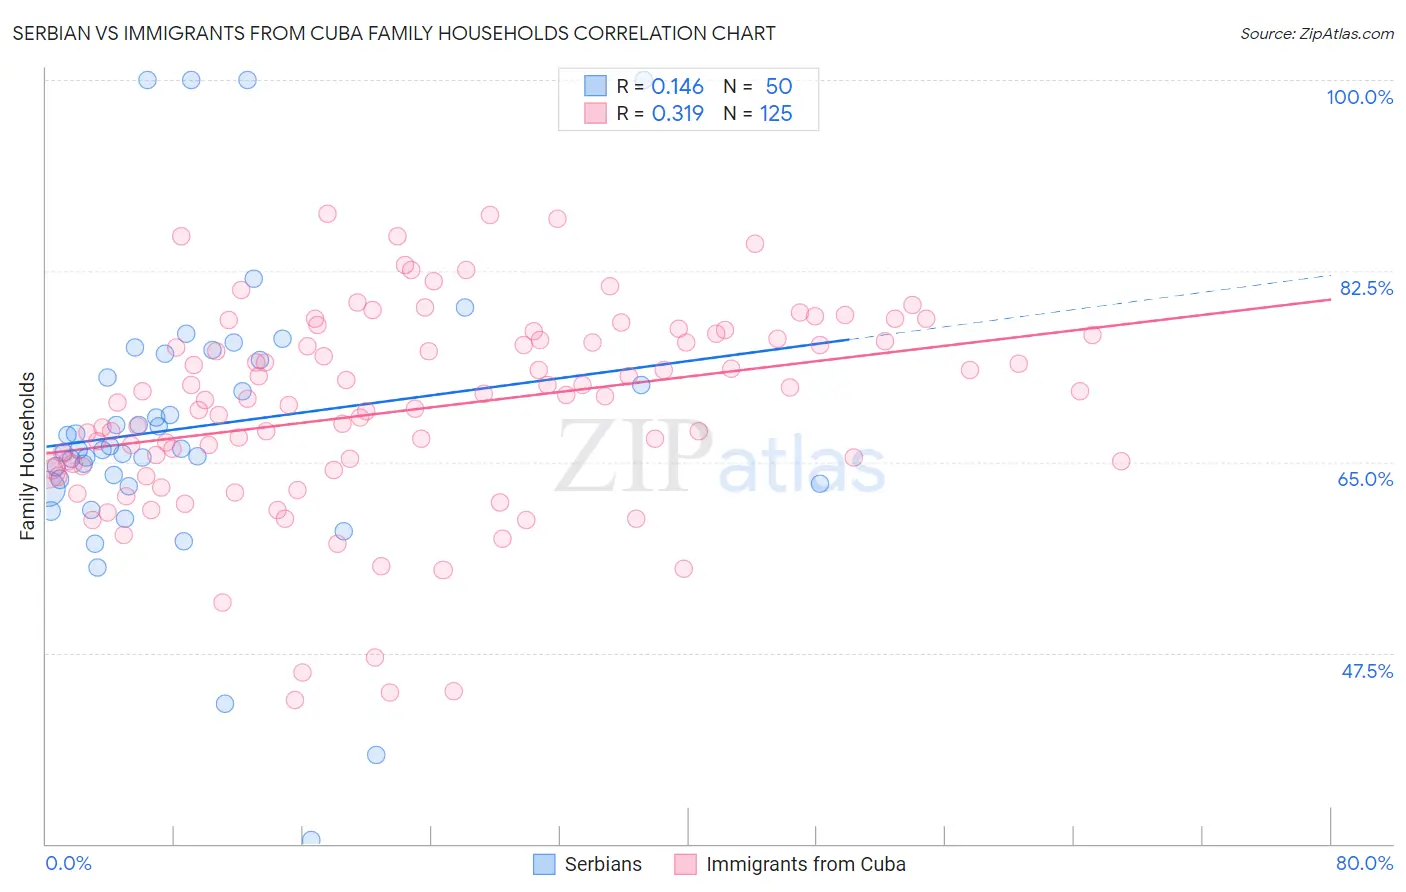
Serbian vs Immigrants from Cuba Family Households Correlation Chart
The statistical analysis conducted on geographies consisting of 267,533,115 people shows a poor positive correlation between the proportion of Serbians and percentage of family households in the United States with a correlation coefficient (R) of 0.146 and weighted average of 63.0%. Similarly, the statistical analysis conducted on geographies consisting of 325,966,420 people shows a mild positive correlation between the proportion of Immigrants from Cuba and percentage of family households in the United States with a correlation coefficient (R) of 0.319 and weighted average of 68.2%, a difference of 8.2%.
Family Households Correlation Summary
| Measurement | Serbian | Immigrants from Cuba |
| Minimum | 30.3% | 43.2% |
| Maximum | 100.0% | 87.7% |
| Range | 69.7% | 44.5% |
| Mean | 68.2% | 69.8% |
| Median | 66.2% | 70.8% |
| Interquartile 25% (IQ1) | 63.0% | 64.5% |
| Interquartile 75% (IQ3) | 74.4% | 76.2% |
| Interquartile Range (IQR) | 11.3% | 11.8% |
| Standard Deviation (Sample) | 13.3% | 9.2% |
| Standard Deviation (Population) | 13.2% | 9.1% |
Similar Demographics by Family Households
Demographics Similar to Serbians by Family Households
In terms of family households, the demographic groups most similar to Serbians are Lumbee (63.1%, a difference of 0.010%), West Indian (63.1%, a difference of 0.010%), Immigrants from Kazakhstan (63.1%, a difference of 0.020%), Immigrants from Croatia (63.1%, a difference of 0.030%), and Immigrants from Turkey (63.1%, a difference of 0.030%).
| Demographics | Rating | Rank | Family Households |
| Yugoslavians | 0.4 /100 | #269 | Tragic 63.1% |
| Immigrants | Austria | 0.3 /100 | #270 | Tragic 63.1% |
| Immigrants | Croatia | 0.3 /100 | #271 | Tragic 63.1% |
| Immigrants | Turkey | 0.3 /100 | #272 | Tragic 63.1% |
| Immigrants | Kazakhstan | 0.3 /100 | #273 | Tragic 63.1% |
| Lumbee | 0.3 /100 | #274 | Tragic 63.1% |
| West Indians | 0.3 /100 | #275 | Tragic 63.1% |
| Serbians | 0.3 /100 | #276 | Tragic 63.0% |
| Ottawa | 0.3 /100 | #277 | Tragic 63.0% |
| Immigrants | Belgium | 0.2 /100 | #278 | Tragic 63.0% |
| Immigrants | Yemen | 0.2 /100 | #279 | Tragic 63.0% |
| Immigrants | Bulgaria | 0.2 /100 | #280 | Tragic 63.0% |
| Estonians | 0.2 /100 | #281 | Tragic 62.9% |
| New Zealanders | 0.1 /100 | #282 | Tragic 62.9% |
| Immigrants | Denmark | 0.1 /100 | #283 | Tragic 62.9% |
Demographics Similar to Immigrants from Cuba by Family Households
In terms of family households, the demographic groups most similar to Immigrants from Cuba are Pueblo (68.2%, a difference of 0.010%), Assyrian/Chaldean/Syriac (68.2%, a difference of 0.060%), Immigrants from Vietnam (68.2%, a difference of 0.060%), Korean (68.3%, a difference of 0.090%), and Chinese (68.1%, a difference of 0.10%).
| Demographics | Rating | Rank | Family Households |
| Mexicans | 100.0 /100 | #7 | Exceptional 69.0% |
| Immigrants | Fiji | 100.0 /100 | #8 | Exceptional 68.8% |
| Native Hawaiians | 100.0 /100 | #9 | Exceptional 68.4% |
| Immigrants | Philippines | 100.0 /100 | #10 | Exceptional 68.3% |
| Immigrants | Central America | 100.0 /100 | #11 | Exceptional 68.3% |
| Koreans | 100.0 /100 | #12 | Exceptional 68.3% |
| Pueblo | 100.0 /100 | #13 | Exceptional 68.2% |
| Immigrants | Cuba | 100.0 /100 | #14 | Exceptional 68.2% |
| Assyrians/Chaldeans/Syriacs | 100.0 /100 | #15 | Exceptional 68.2% |
| Immigrants | Vietnam | 100.0 /100 | #16 | Exceptional 68.2% |
| Chinese | 100.0 /100 | #17 | Exceptional 68.1% |
| Immigrants | Taiwan | 100.0 /100 | #18 | Exceptional 68.0% |
| Samoans | 100.0 /100 | #19 | Exceptional 67.9% |
| Inupiat | 100.0 /100 | #20 | Exceptional 67.8% |
| Cubans | 100.0 /100 | #21 | Exceptional 67.7% |