Icelander vs Immigrants from Cuba Single Female Poverty
COMPARE
Icelander
Immigrants from Cuba
Single Female Poverty
Single Female Poverty Comparison
Icelanders
Immigrants from Cuba
21.6%
SINGLE FEMALE POVERTY
14.0/ 100
METRIC RATING
211th/ 347
METRIC RANK
21.2%
SINGLE FEMALE POVERTY
35.3/ 100
METRIC RATING
189th/ 347
METRIC RANK
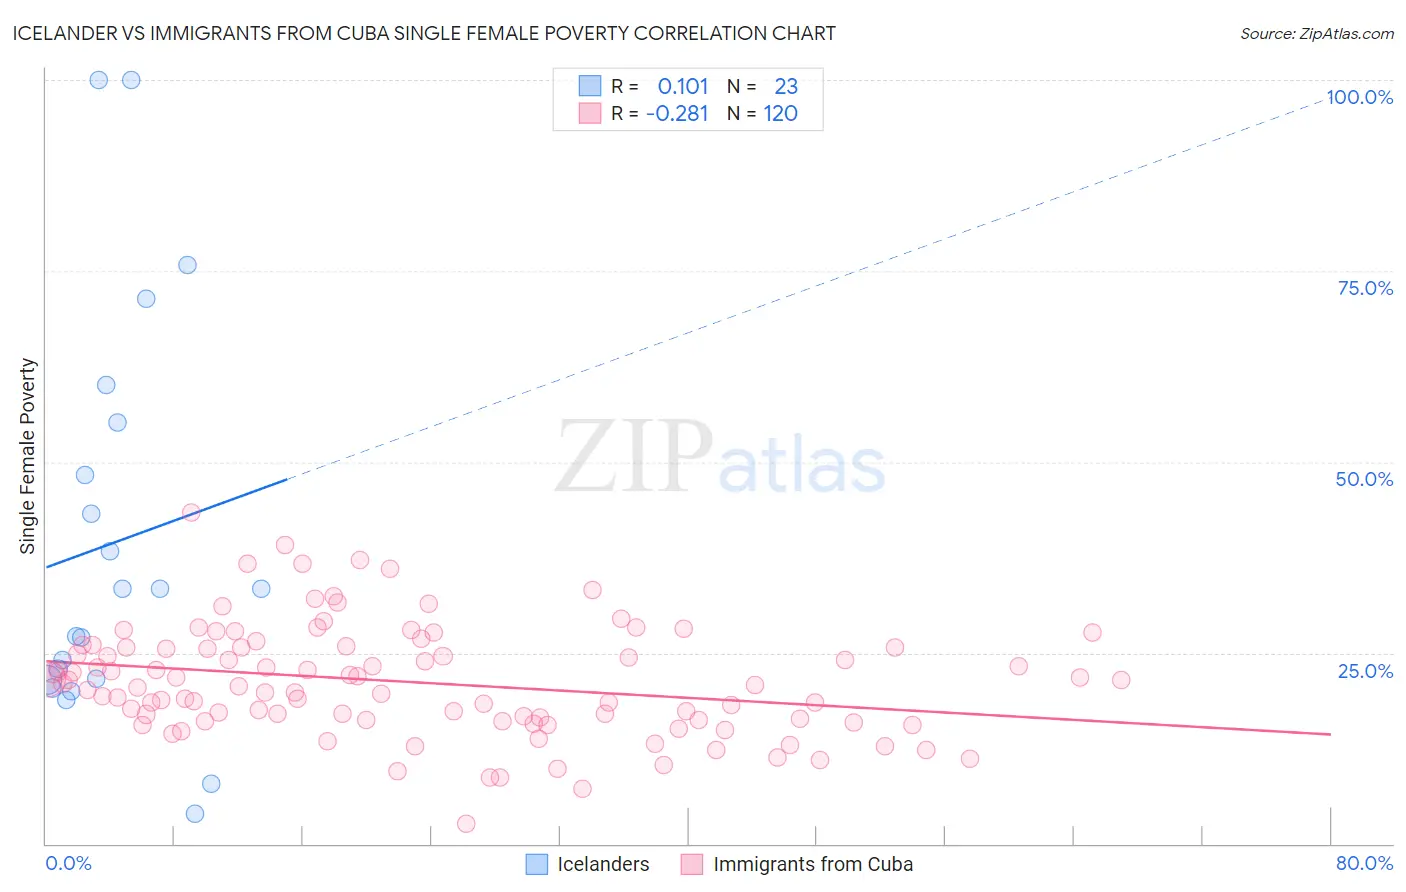
Icelander vs Immigrants from Cuba Single Female Poverty Correlation Chart
The statistical analysis conducted on geographies consisting of 158,245,143 people shows a poor positive correlation between the proportion of Icelanders and poverty level among single females in the United States with a correlation coefficient (R) of 0.101 and weighted average of 21.6%. Similarly, the statistical analysis conducted on geographies consisting of 322,497,975 people shows a weak negative correlation between the proportion of Immigrants from Cuba and poverty level among single females in the United States with a correlation coefficient (R) of -0.281 and weighted average of 21.2%, a difference of 1.9%.
Single Female Poverty Correlation Summary
| Measurement | Icelander | Immigrants from Cuba |
| Minimum | 3.9% | 2.6% |
| Maximum | 100.0% | 43.3% |
| Range | 96.1% | 40.7% |
| Mean | 39.4% | 21.1% |
| Median | 33.3% | 20.7% |
| Interquartile 25% (IQ1) | 21.4% | 16.2% |
| Interquartile 75% (IQ3) | 55.2% | 25.7% |
| Interquartile Range (IQR) | 33.8% | 9.5% |
| Standard Deviation (Sample) | 26.5% | 7.2% |
| Standard Deviation (Population) | 25.9% | 7.2% |
Similar Demographics by Single Female Poverty
Demographics Similar to Icelanders by Single Female Poverty
In terms of single female poverty, the demographic groups most similar to Icelanders are Jamaican (21.6%, a difference of 0.010%), Immigrants from Panama (21.6%, a difference of 0.040%), Guamanian/Chamorro (21.6%, a difference of 0.040%), Immigrants from Nicaragua (21.6%, a difference of 0.10%), and Immigrants from Eastern Africa (21.6%, a difference of 0.13%).
| Demographics | Rating | Rank | Single Female Poverty |
| Immigrants | Africa | 16.7 /100 | #204 | Poor 21.5% |
| Finns | 16.2 /100 | #205 | Poor 21.5% |
| Belgians | 16.1 /100 | #206 | Poor 21.5% |
| Ghanaians | 15.7 /100 | #207 | Poor 21.6% |
| Haitians | 15.4 /100 | #208 | Poor 21.6% |
| Immigrants | Eastern Africa | 15.1 /100 | #209 | Poor 21.6% |
| Immigrants | Panama | 14.4 /100 | #210 | Poor 21.6% |
| Icelanders | 14.0 /100 | #211 | Poor 21.6% |
| Jamaicans | 14.0 /100 | #212 | Poor 21.6% |
| Guamanians/Chamorros | 13.7 /100 | #213 | Poor 21.6% |
| Immigrants | Nicaragua | 13.3 /100 | #214 | Poor 21.6% |
| Ecuadorians | 12.3 /100 | #215 | Poor 21.6% |
| Immigrants | Barbados | 12.2 /100 | #216 | Poor 21.7% |
| Immigrants | St. Vincent and the Grenadines | 11.7 /100 | #217 | Poor 21.7% |
| Nepalese | 9.7 /100 | #218 | Tragic 21.7% |
Demographics Similar to Immigrants from Cuba by Single Female Poverty
In terms of single female poverty, the demographic groups most similar to Immigrants from Cuba are Trinidadian and Tobagonian (21.2%, a difference of 0.0%), Yugoslavian (21.2%, a difference of 0.010%), Immigrants from Nigeria (21.2%, a difference of 0.10%), Hawaiian (21.2%, a difference of 0.16%), and Immigrants from Cambodia (21.2%, a difference of 0.20%).
| Demographics | Rating | Rank | Single Female Poverty |
| Slavs | 40.5 /100 | #182 | Average 21.1% |
| Slovaks | 39.7 /100 | #183 | Fair 21.1% |
| Hungarians | 39.6 /100 | #184 | Fair 21.1% |
| Immigrants | Cambodia | 38.2 /100 | #185 | Fair 21.2% |
| Hawaiians | 37.7 /100 | #186 | Fair 21.2% |
| Immigrants | Nigeria | 36.8 /100 | #187 | Fair 21.2% |
| Yugoslavians | 35.4 /100 | #188 | Fair 21.2% |
| Immigrants | Cuba | 35.3 /100 | #189 | Fair 21.2% |
| Trinidadians and Tobagonians | 35.2 /100 | #190 | Fair 21.2% |
| Immigrants | Germany | 31.1 /100 | #191 | Fair 21.3% |
| Immigrants | Jamaica | 30.5 /100 | #192 | Fair 21.3% |
| Basques | 28.1 /100 | #193 | Fair 21.3% |
| Czechoslovakians | 27.7 /100 | #194 | Fair 21.3% |
| Nicaraguans | 27.6 /100 | #195 | Fair 21.3% |
| Immigrants | Saudi Arabia | 27.1 /100 | #196 | Fair 21.3% |