Senegalese vs Swedish Married-Couple Family Poverty
COMPARE
Senegalese
Swedish
Married-Couple Family Poverty
Married-Couple Family Poverty Comparison
Senegalese
Swedes
6.1%
MARRIED-COUPLE FAMILY POVERTY
0.3/ 100
METRIC RATING
261st/ 347
METRIC RANK
3.9%
MARRIED-COUPLE FAMILY POVERTY
100.0/ 100
METRIC RATING
5th/ 347
METRIC RANK
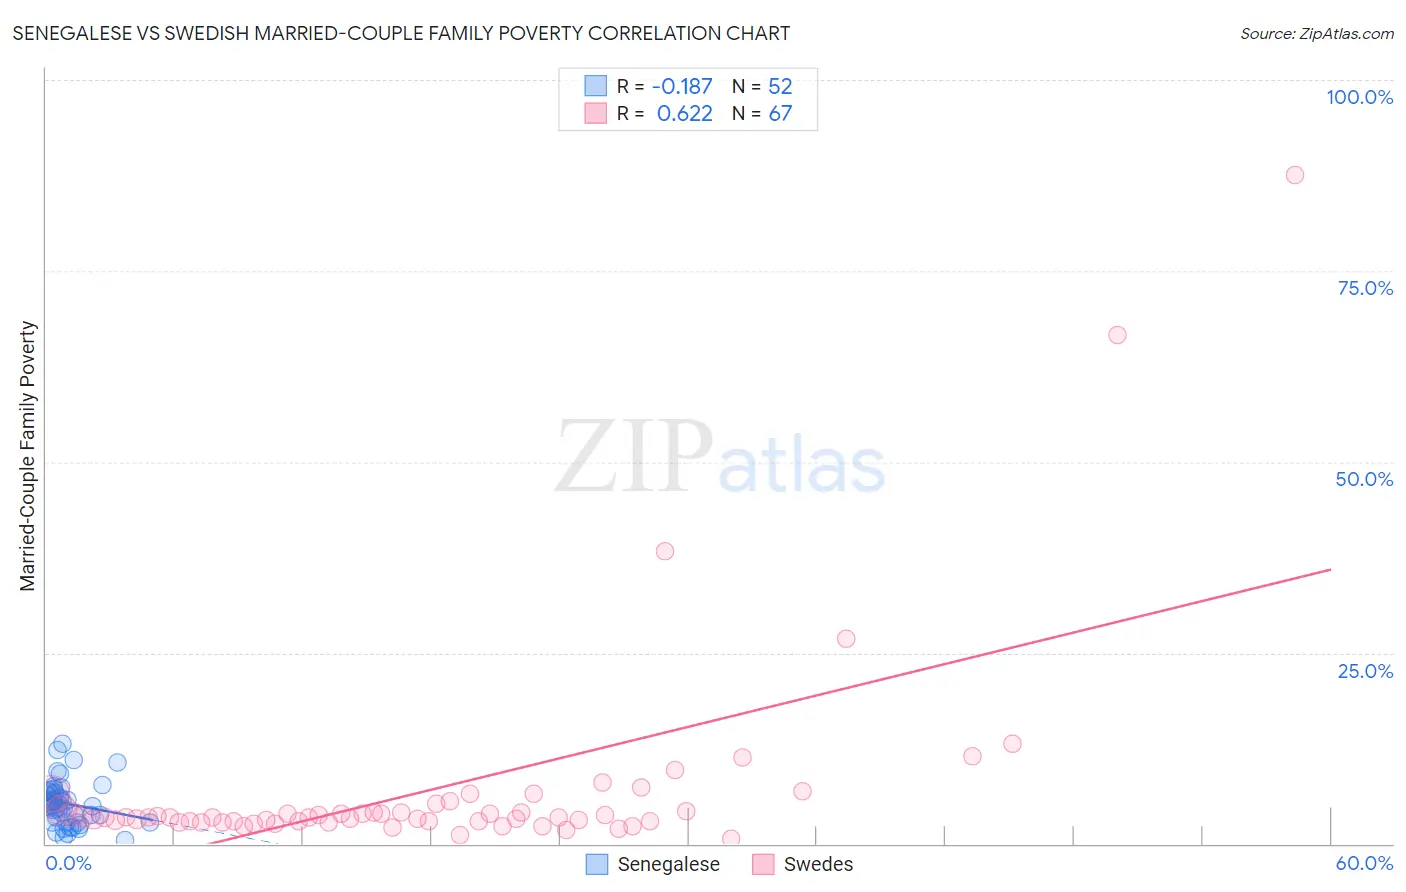
Senegalese vs Swedish Married-Couple Family Poverty Correlation Chart
The statistical analysis conducted on geographies consisting of 78,006,909 people shows a poor negative correlation between the proportion of Senegalese and poverty level among married-couple families in the United States with a correlation coefficient (R) of -0.187 and weighted average of 6.1%. Similarly, the statistical analysis conducted on geographies consisting of 527,096,192 people shows a significant positive correlation between the proportion of Swedes and poverty level among married-couple families in the United States with a correlation coefficient (R) of 0.622 and weighted average of 3.9%, a difference of 58.0%.
Married-Couple Family Poverty Correlation Summary
| Measurement | Senegalese | Swedish |
| Minimum | 0.42% | 0.65% |
| Maximum | 13.1% | 87.5% |
| Range | 12.7% | 86.9% |
| Mean | 5.3% | 7.1% |
| Median | 5.2% | 3.4% |
| Interquartile 25% (IQ1) | 3.1% | 2.9% |
| Interquartile 75% (IQ3) | 6.8% | 4.3% |
| Interquartile Range (IQR) | 3.7% | 1.4% |
| Standard Deviation (Sample) | 2.8% | 13.7% |
| Standard Deviation (Population) | 2.8% | 13.5% |
Similar Demographics by Married-Couple Family Poverty
Demographics Similar to Senegalese by Married-Couple Family Poverty
In terms of married-couple family poverty, the demographic groups most similar to Senegalese are Jamaican (6.1%, a difference of 0.19%), Shoshone (6.1%, a difference of 0.21%), Alaskan Athabascan (6.1%, a difference of 0.40%), Immigrants from Senegal (6.1%, a difference of 0.60%), and Immigrants from Congo (6.1%, a difference of 0.83%).
| Demographics | Rating | Rank | Married-Couple Family Poverty |
| Immigrants | Somalia | 0.7 /100 | #254 | Tragic 6.0% |
| Comanche | 0.7 /100 | #255 | Tragic 6.0% |
| Bangladeshis | 0.5 /100 | #256 | Tragic 6.0% |
| Immigrants | Burma/Myanmar | 0.5 /100 | #257 | Tragic 6.0% |
| Immigrants | Immigrants | 0.5 /100 | #258 | Tragic 6.0% |
| Alaskan Athabascans | 0.4 /100 | #259 | Tragic 6.1% |
| Jamaicans | 0.3 /100 | #260 | Tragic 6.1% |
| Senegalese | 0.3 /100 | #261 | Tragic 6.1% |
| Shoshone | 0.3 /100 | #262 | Tragic 6.1% |
| Immigrants | Senegal | 0.3 /100 | #263 | Tragic 6.1% |
| Immigrants | Congo | 0.2 /100 | #264 | Tragic 6.1% |
| Blackfeet | 0.2 /100 | #265 | Tragic 6.2% |
| Creek | 0.2 /100 | #266 | Tragic 6.2% |
| Spanish Americans | 0.2 /100 | #267 | Tragic 6.2% |
| Alaska Natives | 0.2 /100 | #268 | Tragic 6.2% |
Demographics Similar to Swedes by Married-Couple Family Poverty
In terms of married-couple family poverty, the demographic groups most similar to Swedes are Slovene (3.8%, a difference of 0.15%), Luxembourger (3.9%, a difference of 0.61%), Latvian (3.9%, a difference of 1.1%), Thai (3.9%, a difference of 1.7%), and Croatian (3.9%, a difference of 2.1%).
| Demographics | Rating | Rank | Married-Couple Family Poverty |
| Immigrants | India | 100.0 /100 | #1 | Exceptional 3.6% |
| Chinese | 100.0 /100 | #2 | Exceptional 3.6% |
| Norwegians | 100.0 /100 | #3 | Exceptional 3.7% |
| Slovenes | 100.0 /100 | #4 | Exceptional 3.8% |
| Swedes | 100.0 /100 | #5 | Exceptional 3.9% |
| Luxembourgers | 100.0 /100 | #6 | Exceptional 3.9% |
| Latvians | 100.0 /100 | #7 | Exceptional 3.9% |
| Thais | 100.0 /100 | #8 | Exceptional 3.9% |
| Croatians | 100.0 /100 | #9 | Exceptional 3.9% |
| Carpatho Rusyns | 100.0 /100 | #10 | Exceptional 3.9% |
| Lithuanians | 100.0 /100 | #11 | Exceptional 4.0% |
| Bulgarians | 100.0 /100 | #12 | Exceptional 4.0% |
| Czechs | 100.0 /100 | #13 | Exceptional 4.0% |
| Slovaks | 100.0 /100 | #14 | Exceptional 4.0% |
| Poles | 100.0 /100 | #15 | Exceptional 4.0% |