Senegalese vs Swedish Single Mother Poverty

COMPARE

Senegalese
Race
Ancestry
AfghanAfricanAlaska NativeAlaskan AthabascanAlbanianAleutAlsatianAmericanApacheArabArapahoArgentineanArmenianAssyrian/Chaldean/SyriacAustralianAustrianBahamianBangladeshiBarbadianBasqueBelgianBelizeanBermudanBhutaneseBlackfeetBolivianBrazilianBritishBritish West IndianBulgarianBurmeseCajunCambodianCanadianCape VerdeanCarpatho RusynCelticCentral AmericanCentral American IndianCherokeeCheyenneChickasawChileanChineseChippewaChoctawColombianColvilleComancheCosta RicanCreeCreekCroatianCrowCubanCypriotCzechCzechoslovakianDanishDelawareDominicanDutchDutch West IndianEastern EuropeanEcuadorianEgyptianEnglishEstonianEthiopianEuropeanFijianFilipinoFinnishFrenchFrench American IndianFrench CanadianGermanGerman RussianGhanaianGreekGuamanian/ChamorroGuatemalanGuyaneseHaitianHmongHonduranHopiHoumaHungarianIcelanderIndian (Asian)IndonesianInupiatIranianIraqiIrishIroquoisIsraeliItalianJamaicanJapaneseJordanianKenyanKiowaKoreanLaotianLatvianLebaneseLiberianLithuanianLumbeeLuxembourgerMacedonianMalaysianMalteseMarshalleseMenomineeMexicanMexican American IndianMongolianMoroccanNative HawaiianNavajoNepaleseNew ZealanderNicaraguanNigerianNorthern EuropeanNorwegianOkinawanOsageOttawaPaiutePakistaniPalestinianPanamanianParaguayanPennsylvania GermanPeruvianPimaPolishPortuguesePotawatomiPuebloPuerto RicanPuget Sound SalishRomanianRussianSalvadoranSamoanScandinavianScotch-IrishScottishSeminoleSenegaleseSerbianShoshoneSierra LeoneanSiouxSlavicSlovakSloveneSomaliSouth AfricanSouth AmericanSouth American IndianSoviet UnionSpaniardSpanishSpanish AmericanSpanish American IndianSri LankanSubsaharan AfricanSudaneseSwissSyrianTaiwaneseThaiTlingit-HaidaTohono O'OdhamTonganTrinidadian and TobagonianTsimshianTurkishU.S. Virgin IslanderUgandanUkrainianUruguayanUteVenezuelanVietnameseWelshWest IndianYakamaYaquiYugoslavianYumanYup'ikZimbabwean
Immigration
NonimmigrantsImmigrantsAfghanistanAfricaAlbaniaArgentinaArmeniaAsiaAustraliaAustriaBahamasBangladeshBarbadosBelarusBelgiumBelizeBoliviaBosnia and HerzegovinaBrazilBulgariaBurma/MyanmarCabo VerdeCambodiaCameroonCanadaCaribbeanCentral AmericaChileChinaColombiaCongoCosta RicaCroatiaCubaCzechoslovakiaDenmarkDominicaDominican RepublicEastern AfricaEastern AsiaEastern EuropeEcuadorEgyptEl SalvadorEnglandEritreaEthiopiaEuropeFijiFranceGermanyGhanaGreeceGrenadaGuatemalaGuyanaHaitiHondurasHong KongHungaryIndiaIndonesiaIranIraqIrelandIsraelItalyJamaicaJapanJordanKazakhstanKenyaKoreaKuwaitLaosLatin AmericaLatviaLebanonLiberiaLithuaniaMalaysiaMexicoMicronesiaMiddle AfricaMoldovaMoroccoNepalNetherlandsNicaraguaNigeriaNorth AmericaNorth MacedoniaNorthern AfricaNorthern EuropeNorwayOceaniaPakistanPanamaPeruPhilippinesPolandPortugalRomaniaRussiaSaudi ArabiaScotlandSenegalSerbiaSierra LeoneSingaporeSomaliaSouth AfricaSouth AmericaSouth Central AsiaSouth Eastern AsiaSouthern EuropeSpainSri LankaSt. Vincent and the GrenadinesSudanSwedenSwitzerlandSyriaTaiwanThailandTrinidad and TobagoTurkeyUgandaUkraineUruguayUzbekistanVenezuelaVietnamWest IndiesWestern AfricaWestern AsiaWestern EuropeYemenZaireZimbabweAzores
Swedish
Race
Ancestry
AfghanAfricanAlaska NativeAlaskan AthabascanAlbanianAleutAlsatianAmericanApacheArabArapahoArgentineanArmenianAssyrian/Chaldean/SyriacAustralianAustrianBahamianBangladeshiBarbadianBasqueBelgianBelizeanBermudanBhutaneseBlackfeetBolivianBrazilianBritishBritish West IndianBulgarianBurmeseCajunCambodianCanadianCape VerdeanCarpatho RusynCelticCentral AmericanCentral American IndianCherokeeCheyenneChickasawChileanChineseChippewaChoctawColombianColvilleComancheCosta RicanCreeCreekCroatianCrowCubanCypriotCzechCzechoslovakianDanishDelawareDominicanDutchDutch West IndianEastern EuropeanEcuadorianEgyptianEnglishEstonianEthiopianEuropeanFijianFilipinoFinnishFrenchFrench American IndianFrench CanadianGermanGerman RussianGhanaianGreekGuamanian/ChamorroGuatemalanGuyaneseHaitianHmongHonduranHopiHoumaHungarianIcelanderIndian (Asian)IndonesianInupiatIranianIraqiIrishIroquoisIsraeliItalianJamaicanJapaneseJordanianKenyanKiowaKoreanLaotianLatvianLebaneseLiberianLithuanianLumbeeLuxembourgerMacedonianMalaysianMalteseMarshalleseMenomineeMexicanMexican American IndianMongolianMoroccanNative HawaiianNavajoNepaleseNew ZealanderNicaraguanNigerianNorthern EuropeanNorwegianOkinawanOsageOttawaPaiutePakistaniPalestinianPanamanianParaguayanPennsylvania GermanPeruvianPimaPolishPortuguesePotawatomiPuebloPuerto RicanPuget Sound SalishRomanianRussianSalvadoranSamoanScandinavianScotch-IrishScottishSeminoleSerbianShoshoneSierra LeoneanSiouxSlavicSlovakSloveneSomaliSouth AfricanSouth AmericanSouth American IndianSoviet UnionSpaniardSpanishSpanish AmericanSpanish American IndianSri LankanSubsaharan AfricanSudaneseSwedishSwissSyrianTaiwaneseThaiTlingit-HaidaTohono O'OdhamTonganTrinidadian and TobagonianTsimshianTurkishU.S. Virgin IslanderUgandanUkrainianUruguayanUteVenezuelanVietnameseWelshWest IndianYakamaYaquiYugoslavianYumanYup'ikZimbabwean
Immigration
NonimmigrantsImmigrantsAfghanistanAfricaAlbaniaArgentinaArmeniaAsiaAustraliaAustriaBahamasBangladeshBarbadosBelarusBelgiumBelizeBoliviaBosnia and HerzegovinaBrazilBulgariaBurma/MyanmarCabo VerdeCambodiaCameroonCanadaCaribbeanCentral AmericaChileChinaColombiaCongoCosta RicaCroatiaCubaCzechoslovakiaDenmarkDominicaDominican RepublicEastern AfricaEastern AsiaEastern EuropeEcuadorEgyptEl SalvadorEnglandEritreaEthiopiaEuropeFijiFranceGermanyGhanaGreeceGrenadaGuatemalaGuyanaHaitiHondurasHong KongHungaryIndiaIndonesiaIranIraqIrelandIsraelItalyJamaicaJapanJordanKazakhstanKenyaKoreaKuwaitLaosLatin AmericaLatviaLebanonLiberiaLithuaniaMalaysiaMexicoMicronesiaMiddle AfricaMoldovaMoroccoNepalNetherlandsNicaraguaNigeriaNorth AmericaNorth MacedoniaNorthern AfricaNorthern EuropeNorwayOceaniaPakistanPanamaPeruPhilippinesPolandPortugalRomaniaRussiaSaudi ArabiaScotlandSenegalSerbiaSierra LeoneSingaporeSomaliaSouth AfricaSouth AmericaSouth Central AsiaSouth Eastern AsiaSouthern EuropeSpainSri LankaSt. Vincent and the GrenadinesSudanSwedenSwitzerlandSyriaTaiwanThailandTrinidad and TobagoTurkeyUgandaUkraineUruguayUzbekistanVenezuelaVietnamWest IndiesWestern AfricaWestern AsiaWestern EuropeYemenZaireZimbabweAzores
Single Mother Poverty
Income
Poverty
Unemployment
Labor Participation
Family Structure
Vehicle Availability
Education Level
Disability

Single Mother Poverty Comparison

Senegalese

Swedes

Tragic
Excellent
31.0%
SINGLE MOTHER POVERTY
0.5/ 100
METRIC RATING
254th/ 347
METRIC RANK
28.4%
SINGLE MOTHER POVERTY
89.4/ 100
METRIC RATING
133rd/ 347
METRIC RANK

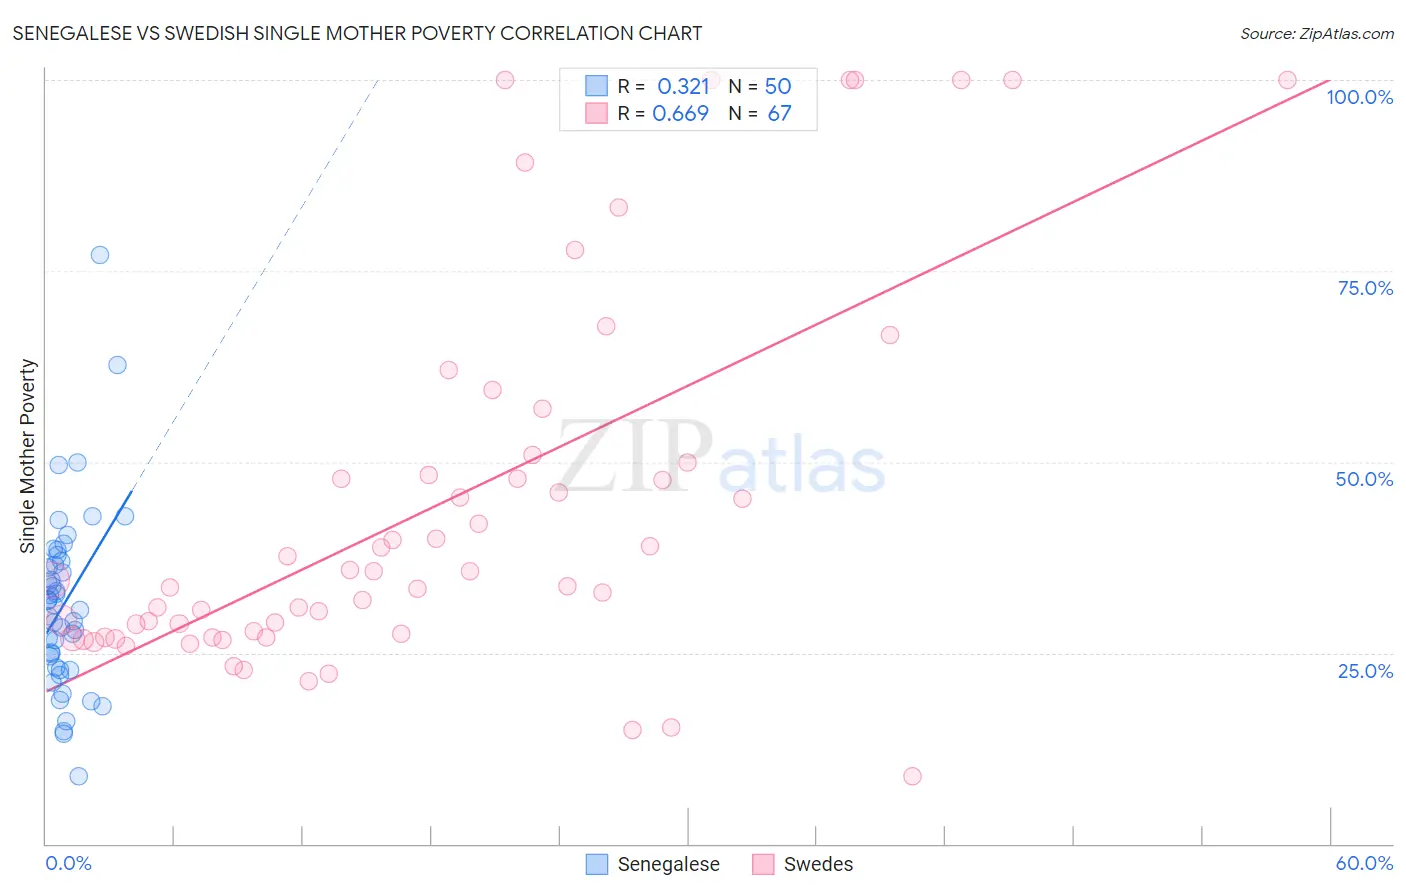
Senegalese vs Swedish Single Mother Poverty Correlation Chart

The statistical analysis conducted on geographies consisting of 77,710,183 people shows a mild positive correlation between the proportion of Senegalese and poverty level among single mothers in the United States with a correlation coefficient (R) of 0.321 and weighted average of 31.0%. Similarly, the statistical analysis conducted on geographies consisting of 514,461,086 people shows a significant positive correlation between the proportion of Swedes and poverty level among single mothers in the United States with a correlation coefficient (R) of 0.669 and weighted average of 28.4%, a difference of 9.0%.
Senegalese vs Swedish Single Mother Poverty

Single Mother Poverty Correlation Summary

MeasurementSenegaleseSwedish
Minimum8.8%8.8%
Maximum77.0%100.0%
Range68.2%91.2%
Mean31.5%44.1%
Median30.9%34.6%
Interquartile 25% (IQ1)23.0%27.1%
Interquartile 75% (IQ3)36.9%50.0%
Interquartile Range (IQR)13.9%22.9%
Standard Deviation (Sample)12.1%24.6%
Standard Deviation (Population)11.9%24.4%

Similar Demographics by Single Mother Poverty

Demographics Similar to Senegalese by Single Mother Poverty

In terms of single mother poverty, the demographic groups most similar to Senegalese are Belizean (31.0%, a difference of 0.11%), Celtic (30.9%, a difference of 0.14%), Tlingit-Haida (30.9%, a difference of 0.18%), Alaska Native (30.9%, a difference of 0.18%), and Vietnamese (30.9%, a difference of 0.31%).
DemographicsRating | RankSingle Mother Poverty
West Indians
0.9
/100
|
#247
Tragic
30.8%
French Canadians
0.9
/100
|
#248
Tragic
30.8%
Cape Verdeans
0.8
/100
|
#249
Tragic
30.8%
Vietnamese
0.7
/100
|
#250
Tragic
30.9%
Tlingit-Haida
0.6
/100
|
#251
Tragic
30.9%
Alaska Natives
0.6
/100
|
#252
Tragic
30.9%
Celtics
0.6
/100
|
#253
Tragic
30.9%
Senegalese
0.5
/100
|
#254
Tragic
31.0%
Belizeans
0.5
/100
|
#255
Tragic
31.0%
Immigrants | West Indies
0.4
/100
|
#256
Tragic
31.1%
Immigrants | Bahamas
0.4
/100
|
#257
Tragic
31.1%
Immigrants | Caribbean
0.4
/100
|
#258
Tragic
31.1%
Immigrants | Bangladesh
0.4
/100
|
#259
Tragic
31.1%
Whites/Caucasians
0.3
/100
|
#260
Tragic
31.2%
Immigrants | El Salvador
0.3
/100
|
#261
Tragic
31.2%

Demographics Similar to Swedes by Single Mother Poverty

In terms of single mother poverty, the demographic groups most similar to Swedes are Immigrants from Morocco (28.4%, a difference of 0.0%), Immigrants from Southern Europe (28.4%, a difference of 0.030%), Immigrants from Spain (28.4%, a difference of 0.030%), Native Hawaiian (28.4%, a difference of 0.060%), and Immigrants from Canada (28.4%, a difference of 0.070%).
DemographicsRating | RankSingle Mother Poverty
Immigrants | Chile
90.8
/100
|
#126
Exceptional
28.4%
Poles
90.8
/100
|
#127
Exceptional
28.4%
Immigrants | England
90.5
/100
|
#128
Exceptional
28.4%
South Americans
90.4
/100
|
#129
Exceptional
28.4%
Norwegians
90.4
/100
|
#130
Exceptional
28.4%
Immigrants | Austria
90.3
/100
|
#131
Exceptional
28.4%
Immigrants | Morocco
89.5
/100
|
#132
Excellent
28.4%
Swedes
89.4
/100
|
#133
Excellent
28.4%
Immigrants | Southern Europe
89.2
/100
|
#134
Excellent
28.4%
Immigrants | Spain
89.2
/100
|
#135
Excellent
28.4%
Native Hawaiians
88.9
/100
|
#136
Excellent
28.4%
Immigrants | Canada
88.9
/100
|
#137
Excellent
28.4%
Immigrants | Belgium
88.5
/100
|
#138
Excellent
28.5%
Samoans
88.1
/100
|
#139
Excellent
28.5%
Immigrants | Colombia
88.0
/100
|
#140
Excellent
28.5%