Senegalese vs Immigrants from Moldova Single Mother Poverty
COMPARE
Senegalese
Immigrants from Moldova
Single Mother Poverty
Single Mother Poverty Comparison
Senegalese
Immigrants from Moldova
31.0%
SINGLE MOTHER POVERTY
0.5/ 100
METRIC RATING
254th/ 347
METRIC RANK
26.2%
SINGLE MOTHER POVERTY
100.0/ 100
METRIC RATING
24th/ 347
METRIC RANK
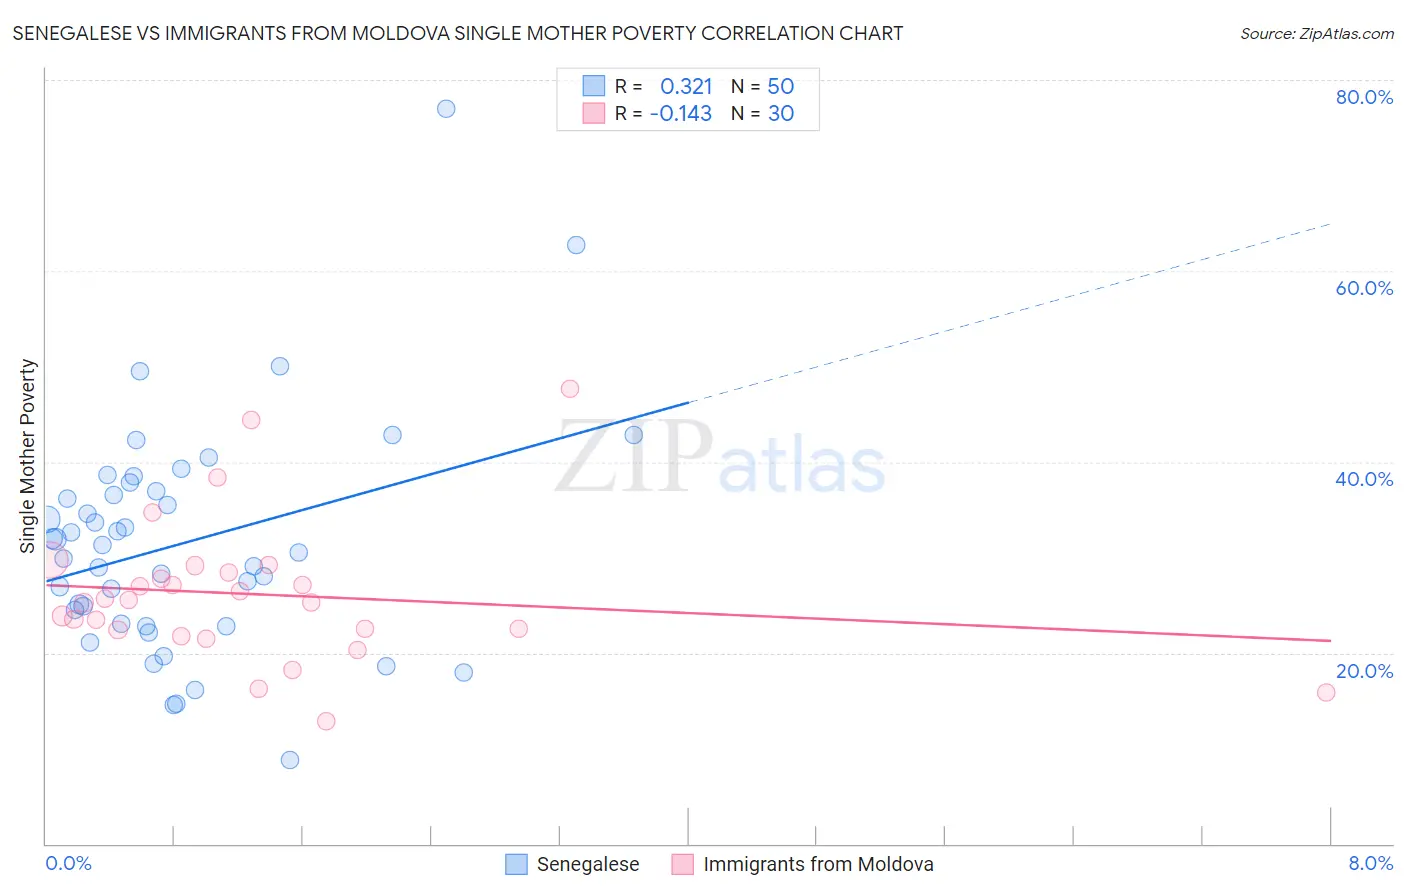
Senegalese vs Immigrants from Moldova Single Mother Poverty Correlation Chart
The statistical analysis conducted on geographies consisting of 77,710,183 people shows a mild positive correlation between the proportion of Senegalese and poverty level among single mothers in the United States with a correlation coefficient (R) of 0.321 and weighted average of 31.0%. Similarly, the statistical analysis conducted on geographies consisting of 123,037,765 people shows a poor negative correlation between the proportion of Immigrants from Moldova and poverty level among single mothers in the United States with a correlation coefficient (R) of -0.143 and weighted average of 26.2%, a difference of 18.0%.
Single Mother Poverty Correlation Summary
| Measurement | Senegalese | Immigrants from Moldova |
| Minimum | 8.8% | 12.8% |
| Maximum | 77.0% | 47.6% |
| Range | 68.2% | 34.8% |
| Mean | 31.5% | 26.1% |
| Median | 30.9% | 25.4% |
| Interquartile 25% (IQ1) | 23.0% | 22.4% |
| Interquartile 75% (IQ3) | 36.9% | 28.4% |
| Interquartile Range (IQR) | 13.9% | 5.9% |
| Standard Deviation (Sample) | 12.1% | 7.5% |
| Standard Deviation (Population) | 11.9% | 7.4% |
Similar Demographics by Single Mother Poverty
Demographics Similar to Senegalese by Single Mother Poverty
In terms of single mother poverty, the demographic groups most similar to Senegalese are Belizean (31.0%, a difference of 0.11%), Celtic (30.9%, a difference of 0.14%), Tlingit-Haida (30.9%, a difference of 0.18%), Alaska Native (30.9%, a difference of 0.18%), and Vietnamese (30.9%, a difference of 0.31%).
| Demographics | Rating | Rank | Single Mother Poverty |
| West Indians | 0.9 /100 | #247 | Tragic 30.8% |
| French Canadians | 0.9 /100 | #248 | Tragic 30.8% |
| Cape Verdeans | 0.8 /100 | #249 | Tragic 30.8% |
| Vietnamese | 0.7 /100 | #250 | Tragic 30.9% |
| Tlingit-Haida | 0.6 /100 | #251 | Tragic 30.9% |
| Alaska Natives | 0.6 /100 | #252 | Tragic 30.9% |
| Celtics | 0.6 /100 | #253 | Tragic 30.9% |
| Senegalese | 0.5 /100 | #254 | Tragic 31.0% |
| Belizeans | 0.5 /100 | #255 | Tragic 31.0% |
| Immigrants | West Indies | 0.4 /100 | #256 | Tragic 31.1% |
| Immigrants | Bahamas | 0.4 /100 | #257 | Tragic 31.1% |
| Immigrants | Caribbean | 0.4 /100 | #258 | Tragic 31.1% |
| Immigrants | Bangladesh | 0.4 /100 | #259 | Tragic 31.1% |
| Whites/Caucasians | 0.3 /100 | #260 | Tragic 31.2% |
| Immigrants | El Salvador | 0.3 /100 | #261 | Tragic 31.2% |
Demographics Similar to Immigrants from Moldova by Single Mother Poverty
In terms of single mother poverty, the demographic groups most similar to Immigrants from Moldova are Burmese (26.2%, a difference of 0.020%), Immigrants from Asia (26.3%, a difference of 0.19%), Immigrants from Korea (26.2%, a difference of 0.20%), Immigrants from Sri Lanka (26.3%, a difference of 0.32%), and Immigrants from Bolivia (26.2%, a difference of 0.37%).
| Demographics | Rating | Rank | Single Mother Poverty |
| Asians | 100.0 /100 | #17 | Exceptional 26.0% |
| Immigrants | Pakistan | 100.0 /100 | #18 | Exceptional 26.0% |
| Immigrants | Eastern Asia | 100.0 /100 | #19 | Exceptional 26.1% |
| Immigrants | China | 100.0 /100 | #20 | Exceptional 26.1% |
| Immigrants | Bolivia | 100.0 /100 | #21 | Exceptional 26.2% |
| Immigrants | Korea | 100.0 /100 | #22 | Exceptional 26.2% |
| Burmese | 100.0 /100 | #23 | Exceptional 26.2% |
| Immigrants | Moldova | 100.0 /100 | #24 | Exceptional 26.2% |
| Immigrants | Asia | 100.0 /100 | #25 | Exceptional 26.3% |
| Immigrants | Sri Lanka | 100.0 /100 | #26 | Exceptional 26.3% |
| Immigrants | Japan | 100.0 /100 | #27 | Exceptional 26.4% |
| Koreans | 100.0 /100 | #28 | Exceptional 26.4% |
| Jordanians | 100.0 /100 | #29 | Exceptional 26.4% |
| Turks | 100.0 /100 | #30 | Exceptional 26.4% |
| Immigrants | Philippines | 100.0 /100 | #31 | Exceptional 26.5% |