Senegalese vs Sudanese 5th Grade
COMPARE
Senegalese
Sudanese
5th Grade
5th Grade Comparison
Senegalese
Sudanese
97.0%
5TH GRADE
2.8/ 100
METRIC RATING
236th/ 347
METRIC RANK
97.1%
5TH GRADE
7.0/ 100
METRIC RATING
216th/ 347
METRIC RANK
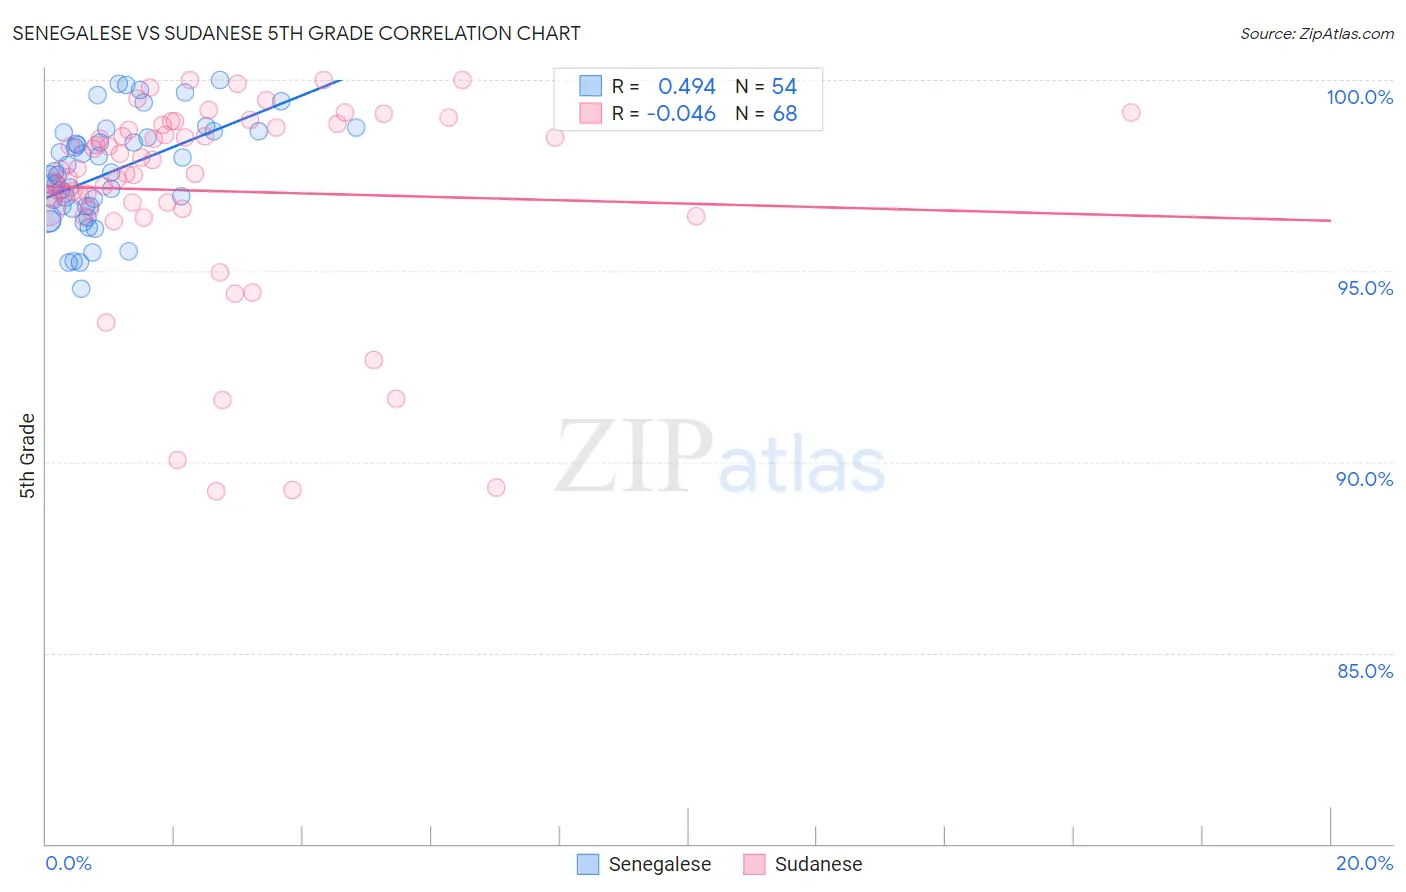
Senegalese vs Sudanese 5th Grade Correlation Chart
The statistical analysis conducted on geographies consisting of 78,142,569 people shows a moderate positive correlation between the proportion of Senegalese and percentage of population with at least 5th grade education in the United States with a correlation coefficient (R) of 0.494 and weighted average of 97.0%. Similarly, the statistical analysis conducted on geographies consisting of 110,147,806 people shows no correlation between the proportion of Sudanese and percentage of population with at least 5th grade education in the United States with a correlation coefficient (R) of -0.046 and weighted average of 97.1%, a difference of 0.10%.
5th Grade Correlation Summary
| Measurement | Senegalese | Sudanese |
| Minimum | 94.5% | 89.2% |
| Maximum | 100.0% | 100.0% |
| Range | 5.5% | 10.8% |
| Mean | 97.6% | 97.1% |
| Median | 97.5% | 97.7% |
| Interquartile 25% (IQ1) | 96.7% | 96.6% |
| Interquartile 75% (IQ3) | 98.6% | 98.8% |
| Interquartile Range (IQR) | 1.9% | 2.1% |
| Standard Deviation (Sample) | 1.4% | 2.6% |
| Standard Deviation (Population) | 1.4% | 2.6% |
Demographics Similar to Senegalese and Sudanese by 5th Grade
In terms of 5th grade, the demographic groups most similar to Senegalese are Subsaharan African (97.0%, a difference of 0.020%), Tohono O'odham (97.0%, a difference of 0.020%), Uruguayan (97.0%, a difference of 0.020%), Immigrants from Malaysia (97.0%, a difference of 0.040%), and Immigrants from Eastern Asia (97.0%, a difference of 0.040%). Similarly, the demographic groups most similar to Sudanese are Immigrants from Lebanon (97.1%, a difference of 0.0%), Immigrants from Sudan (97.1%, a difference of 0.010%), Immigrants from Syria (97.1%, a difference of 0.010%), Immigrants from Southern Europe (97.1%, a difference of 0.010%), and Sierra Leonean (97.1%, a difference of 0.020%).
| Demographics | Rating | Rank | 5th Grade |
| Sudanese | 7.0 /100 | #216 | Tragic 97.1% |
| Immigrants | Lebanon | 6.8 /100 | #217 | Tragic 97.1% |
| Immigrants | Sudan | 6.5 /100 | #218 | Tragic 97.1% |
| Immigrants | Syria | 6.4 /100 | #219 | Tragic 97.1% |
| Immigrants | Southern Europe | 6.3 /100 | #220 | Tragic 97.1% |
| Sierra Leoneans | 6.0 /100 | #221 | Tragic 97.1% |
| Immigrants | Panama | 5.7 /100 | #222 | Tragic 97.0% |
| Liberians | 5.7 /100 | #223 | Tragic 97.0% |
| South American Indians | 5.4 /100 | #224 | Tragic 97.0% |
| Bahamians | 5.3 /100 | #225 | Tragic 97.0% |
| Tongans | 5.3 /100 | #226 | Tragic 97.0% |
| Immigrants | Pakistan | 4.7 /100 | #227 | Tragic 97.0% |
| Assyrians/Chaldeans/Syriacs | 4.5 /100 | #228 | Tragic 97.0% |
| Yuman | 4.5 /100 | #229 | Tragic 97.0% |
| Immigrants | Western Asia | 4.3 /100 | #230 | Tragic 97.0% |
| Immigrants | Malaysia | 4.1 /100 | #231 | Tragic 97.0% |
| Immigrants | Eastern Asia | 4.0 /100 | #232 | Tragic 97.0% |
| Sub-Saharan Africans | 3.3 /100 | #233 | Tragic 97.0% |
| Tohono O'odham | 3.2 /100 | #234 | Tragic 97.0% |
| Uruguayans | 3.2 /100 | #235 | Tragic 97.0% |
| Senegalese | 2.8 /100 | #236 | Tragic 97.0% |