Senegalese vs Sudanese Median Female Earnings
COMPARE
Senegalese
Sudanese
Median Female Earnings
Median Female Earnings Comparison
Senegalese
Sudanese
$39,384
MEDIAN FEMALE EARNINGS
34.2/ 100
METRIC RATING
189th/ 347
METRIC RANK
$38,215
MEDIAN FEMALE EARNINGS
4.4/ 100
METRIC RATING
235th/ 347
METRIC RANK
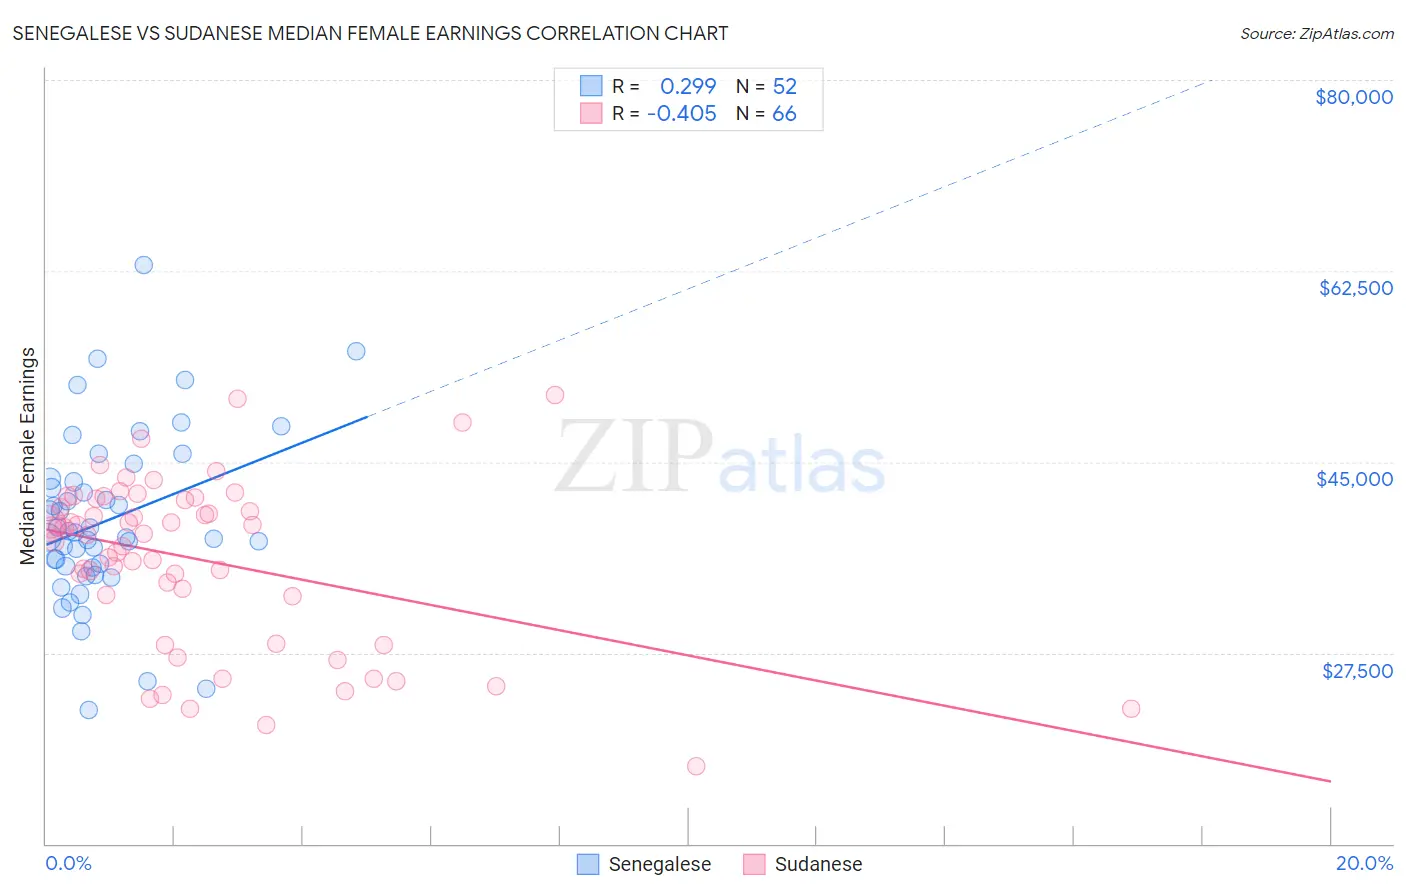
Senegalese vs Sudanese Median Female Earnings Correlation Chart
The statistical analysis conducted on geographies consisting of 78,104,317 people shows a weak positive correlation between the proportion of Senegalese and median female earnings in the United States with a correlation coefficient (R) of 0.299 and weighted average of $39,384. Similarly, the statistical analysis conducted on geographies consisting of 110,138,863 people shows a moderate negative correlation between the proportion of Sudanese and median female earnings in the United States with a correlation coefficient (R) of -0.405 and weighted average of $38,215, a difference of 3.1%.
Median Female Earnings Correlation Summary
| Measurement | Senegalese | Sudanese |
| Minimum | $22,259 | $17,051 |
| Maximum | $63,050 | $51,172 |
| Range | $40,791 | $34,121 |
| Mean | $39,635 | $36,010 |
| Median | $38,318 | $38,359 |
| Interquartile 25% (IQ1) | $35,367 | $32,734 |
| Interquartile 75% (IQ3) | $43,341 | $41,525 |
| Interquartile Range (IQR) | $7,973 | $8,791 |
| Standard Deviation (Sample) | $7,802 | $7,666 |
| Standard Deviation (Population) | $7,727 | $7,607 |
Similar Demographics by Median Female Earnings
Demographics Similar to Senegalese by Median Female Earnings
In terms of median female earnings, the demographic groups most similar to Senegalese are Puget Sound Salish ($39,376, a difference of 0.020%), Immigrants from Western Africa ($39,351, a difference of 0.080%), Swedish ($39,421, a difference of 0.090%), Bermudan ($39,418, a difference of 0.090%), and Immigrants from West Indies ($39,441, a difference of 0.14%).
| Demographics | Rating | Rank | Median Female Earnings |
| Tlingit-Haida | 40.5 /100 | #182 | Average $39,513 |
| Hungarians | 40.3 /100 | #183 | Average $39,510 |
| Europeans | 37.7 /100 | #184 | Fair $39,457 |
| Immigrants | West Indies | 36.9 /100 | #185 | Fair $39,441 |
| Colombians | 36.9 /100 | #186 | Fair $39,439 |
| Swedes | 36.0 /100 | #187 | Fair $39,421 |
| Bermudans | 35.9 /100 | #188 | Fair $39,418 |
| Senegalese | 34.2 /100 | #189 | Fair $39,384 |
| Puget Sound Salish | 33.9 /100 | #190 | Fair $39,376 |
| Immigrants | Western Africa | 32.7 /100 | #191 | Fair $39,351 |
| Immigrants | Immigrants | 31.7 /100 | #192 | Fair $39,328 |
| Immigrants | Nigeria | 30.2 /100 | #193 | Fair $39,294 |
| Irish | 30.0 /100 | #194 | Fair $39,291 |
| Uruguayans | 27.3 /100 | #195 | Fair $39,228 |
| Immigrants | Costa Rica | 25.6 /100 | #196 | Fair $39,186 |
Demographics Similar to Sudanese by Median Female Earnings
In terms of median female earnings, the demographic groups most similar to Sudanese are Liberian ($38,215, a difference of 0.0%), Immigrants from Cabo Verde ($38,208, a difference of 0.020%), Alaska Native ($38,202, a difference of 0.040%), English ($38,196, a difference of 0.050%), and Finnish ($38,173, a difference of 0.11%).
| Demographics | Rating | Rank | Median Female Earnings |
| Sub-Saharan Africans | 6.2 /100 | #228 | Tragic $38,391 |
| Belgians | 6.1 /100 | #229 | Tragic $38,382 |
| Basques | 5.7 /100 | #230 | Tragic $38,352 |
| Somalis | 5.5 /100 | #231 | Tragic $38,333 |
| Scandinavians | 5.2 /100 | #232 | Tragic $38,306 |
| Tongans | 5.1 /100 | #233 | Tragic $38,288 |
| Celtics | 5.0 /100 | #234 | Tragic $38,283 |
| Sudanese | 4.4 /100 | #235 | Tragic $38,215 |
| Liberians | 4.4 /100 | #236 | Tragic $38,215 |
| Immigrants | Cabo Verde | 4.3 /100 | #237 | Tragic $38,208 |
| Alaska Natives | 4.3 /100 | #238 | Tragic $38,202 |
| English | 4.2 /100 | #239 | Tragic $38,196 |
| Finns | 4.0 /100 | #240 | Tragic $38,173 |
| Spanish | 3.5 /100 | #241 | Tragic $38,098 |
| Immigrants | Burma/Myanmar | 3.0 /100 | #242 | Tragic $38,028 |