Senegalese vs Immigrants from Czechoslovakia Single Mother Poverty
COMPARE
Senegalese
Immigrants from Czechoslovakia
Single Mother Poverty
Single Mother Poverty Comparison
Senegalese
Immigrants from Czechoslovakia
31.0%
SINGLE MOTHER POVERTY
0.5/ 100
METRIC RATING
254th/ 347
METRIC RANK
27.4%
SINGLE MOTHER POVERTY
99.5/ 100
METRIC RATING
68th/ 347
METRIC RANK
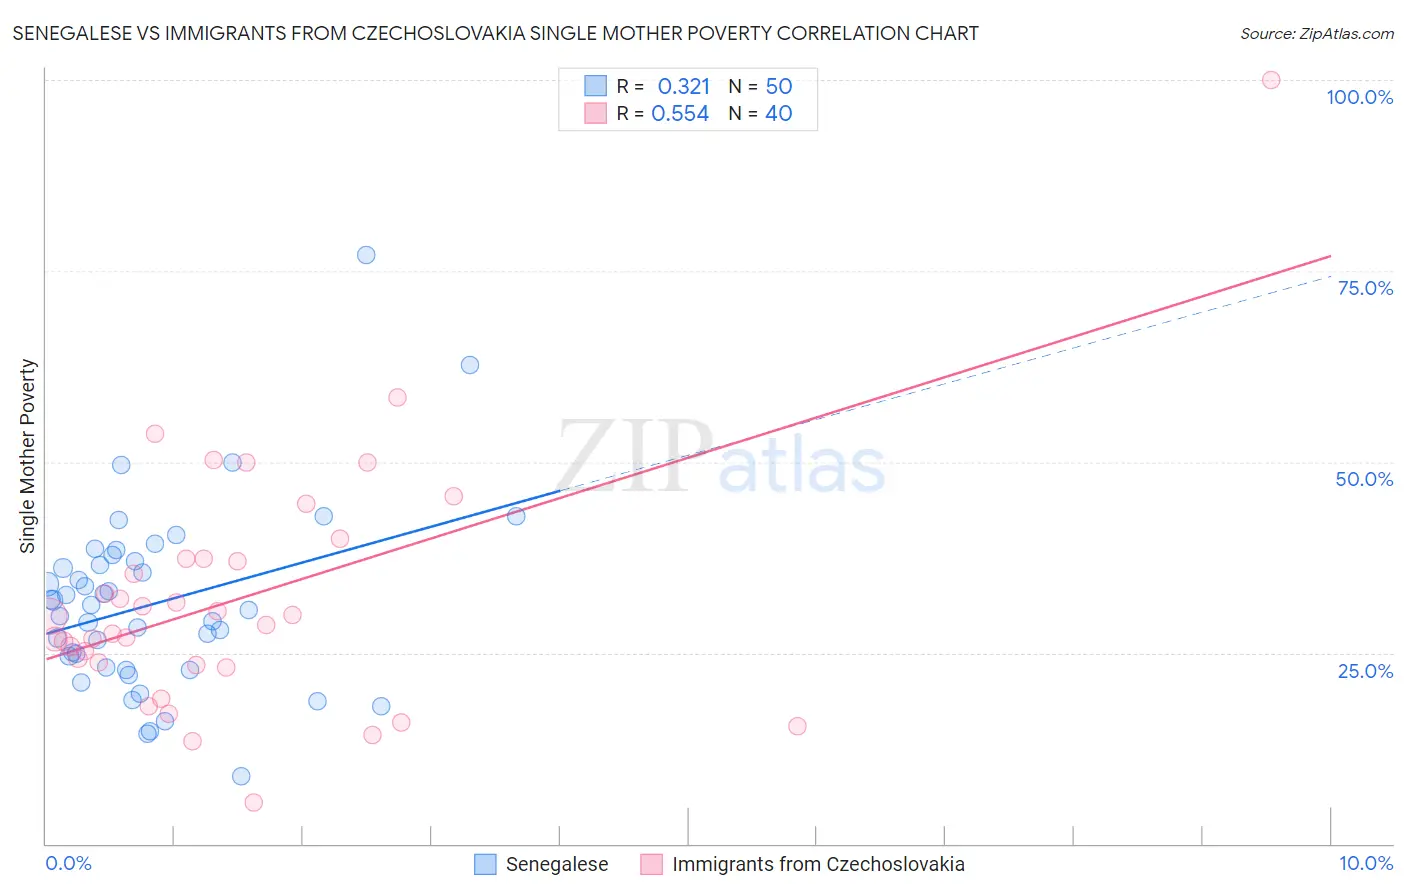
Senegalese vs Immigrants from Czechoslovakia Single Mother Poverty Correlation Chart
The statistical analysis conducted on geographies consisting of 77,710,183 people shows a mild positive correlation between the proportion of Senegalese and poverty level among single mothers in the United States with a correlation coefficient (R) of 0.321 and weighted average of 31.0%. Similarly, the statistical analysis conducted on geographies consisting of 191,942,297 people shows a substantial positive correlation between the proportion of Immigrants from Czechoslovakia and poverty level among single mothers in the United States with a correlation coefficient (R) of 0.554 and weighted average of 27.4%, a difference of 13.3%.
Single Mother Poverty Correlation Summary
| Measurement | Senegalese | Immigrants from Czechoslovakia |
| Minimum | 8.8% | 5.4% |
| Maximum | 77.0% | 100.0% |
| Range | 68.2% | 94.6% |
| Mean | 31.5% | 32.1% |
| Median | 30.9% | 29.1% |
| Interquartile 25% (IQ1) | 23.0% | 23.6% |
| Interquartile 75% (IQ3) | 36.9% | 37.3% |
| Interquartile Range (IQR) | 13.9% | 13.7% |
| Standard Deviation (Sample) | 12.1% | 16.2% |
| Standard Deviation (Population) | 11.9% | 16.0% |
Similar Demographics by Single Mother Poverty
Demographics Similar to Senegalese by Single Mother Poverty
In terms of single mother poverty, the demographic groups most similar to Senegalese are Belizean (31.0%, a difference of 0.11%), Celtic (30.9%, a difference of 0.14%), Tlingit-Haida (30.9%, a difference of 0.18%), Alaska Native (30.9%, a difference of 0.18%), and Vietnamese (30.9%, a difference of 0.31%).
| Demographics | Rating | Rank | Single Mother Poverty |
| West Indians | 0.9 /100 | #247 | Tragic 30.8% |
| French Canadians | 0.9 /100 | #248 | Tragic 30.8% |
| Cape Verdeans | 0.8 /100 | #249 | Tragic 30.8% |
| Vietnamese | 0.7 /100 | #250 | Tragic 30.9% |
| Tlingit-Haida | 0.6 /100 | #251 | Tragic 30.9% |
| Alaska Natives | 0.6 /100 | #252 | Tragic 30.9% |
| Celtics | 0.6 /100 | #253 | Tragic 30.9% |
| Senegalese | 0.5 /100 | #254 | Tragic 31.0% |
| Belizeans | 0.5 /100 | #255 | Tragic 31.0% |
| Immigrants | West Indies | 0.4 /100 | #256 | Tragic 31.1% |
| Immigrants | Bahamas | 0.4 /100 | #257 | Tragic 31.1% |
| Immigrants | Caribbean | 0.4 /100 | #258 | Tragic 31.1% |
| Immigrants | Bangladesh | 0.4 /100 | #259 | Tragic 31.1% |
| Whites/Caucasians | 0.3 /100 | #260 | Tragic 31.2% |
| Immigrants | El Salvador | 0.3 /100 | #261 | Tragic 31.2% |
Demographics Similar to Immigrants from Czechoslovakia by Single Mother Poverty
In terms of single mother poverty, the demographic groups most similar to Immigrants from Czechoslovakia are Immigrants from Australia (27.3%, a difference of 0.030%), Soviet Union (27.3%, a difference of 0.050%), Immigrants from Turkey (27.3%, a difference of 0.090%), Lithuanian (27.4%, a difference of 0.16%), and Russian (27.3%, a difference of 0.17%).
| Demographics | Rating | Rank | Single Mother Poverty |
| Immigrants | Eastern Europe | 99.6 /100 | #61 | Exceptional 27.2% |
| Immigrants | Malaysia | 99.5 /100 | #62 | Exceptional 27.3% |
| Immigrants | Northern Europe | 99.5 /100 | #63 | Exceptional 27.3% |
| Russians | 99.5 /100 | #64 | Exceptional 27.3% |
| Immigrants | Turkey | 99.5 /100 | #65 | Exceptional 27.3% |
| Soviet Union | 99.5 /100 | #66 | Exceptional 27.3% |
| Immigrants | Australia | 99.5 /100 | #67 | Exceptional 27.3% |
| Immigrants | Czechoslovakia | 99.5 /100 | #68 | Exceptional 27.4% |
| Lithuanians | 99.4 /100 | #69 | Exceptional 27.4% |
| Immigrants | Belarus | 99.4 /100 | #70 | Exceptional 27.4% |
| Macedonians | 99.4 /100 | #71 | Exceptional 27.4% |
| Immigrants | Russia | 99.4 /100 | #72 | Exceptional 27.4% |
| Sierra Leoneans | 99.3 /100 | #73 | Exceptional 27.4% |
| Immigrants | Europe | 99.3 /100 | #74 | Exceptional 27.4% |
| Immigrants | Sweden | 99.2 /100 | #75 | Exceptional 27.5% |