Senegalese vs Inupiat Single Mother Poverty
COMPARE
Senegalese
Inupiat
Single Mother Poverty
Single Mother Poverty Comparison
Senegalese
Inupiat
31.0%
SINGLE MOTHER POVERTY
0.5/ 100
METRIC RATING
254th/ 347
METRIC RANK
29.0%
SINGLE MOTHER POVERTY
60.4/ 100
METRIC RATING
166th/ 347
METRIC RANK
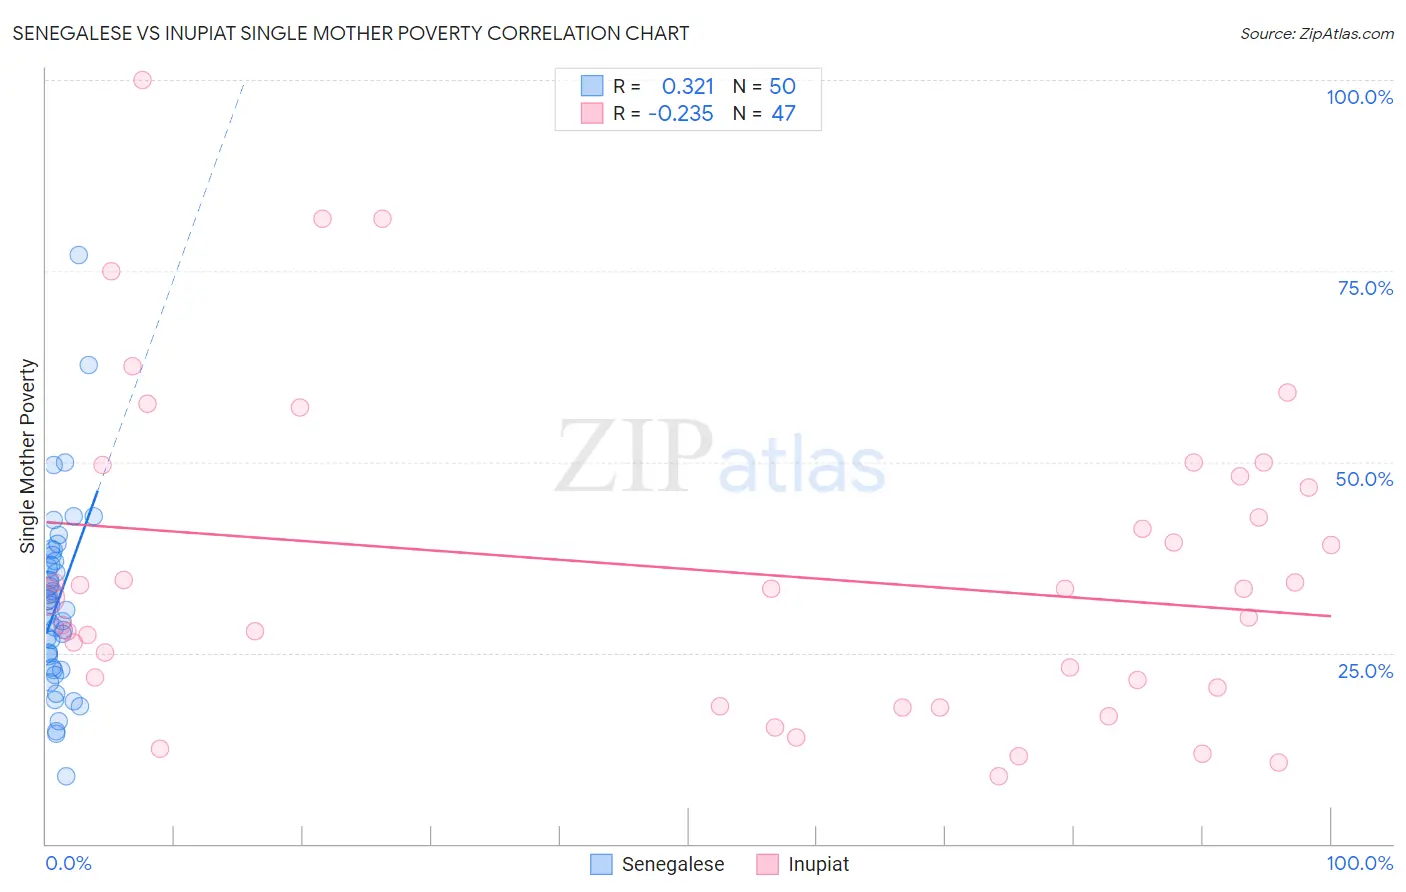
Senegalese vs Inupiat Single Mother Poverty Correlation Chart
The statistical analysis conducted on geographies consisting of 77,710,183 people shows a mild positive correlation between the proportion of Senegalese and poverty level among single mothers in the United States with a correlation coefficient (R) of 0.321 and weighted average of 31.0%. Similarly, the statistical analysis conducted on geographies consisting of 95,875,547 people shows a weak negative correlation between the proportion of Inupiat and poverty level among single mothers in the United States with a correlation coefficient (R) of -0.235 and weighted average of 29.0%, a difference of 6.8%.
Single Mother Poverty Correlation Summary
| Measurement | Senegalese | Inupiat |
| Minimum | 8.8% | 8.8% |
| Maximum | 77.0% | 100.0% |
| Range | 68.2% | 91.2% |
| Mean | 31.5% | 35.8% |
| Median | 30.9% | 33.3% |
| Interquartile 25% (IQ1) | 23.0% | 20.5% |
| Interquartile 75% (IQ3) | 36.9% | 48.1% |
| Interquartile Range (IQR) | 13.9% | 27.6% |
| Standard Deviation (Sample) | 12.1% | 20.7% |
| Standard Deviation (Population) | 11.9% | 20.5% |
Similar Demographics by Single Mother Poverty
Demographics Similar to Senegalese by Single Mother Poverty
In terms of single mother poverty, the demographic groups most similar to Senegalese are Belizean (31.0%, a difference of 0.11%), Celtic (30.9%, a difference of 0.14%), Tlingit-Haida (30.9%, a difference of 0.18%), Alaska Native (30.9%, a difference of 0.18%), and Vietnamese (30.9%, a difference of 0.31%).
| Demographics | Rating | Rank | Single Mother Poverty |
| West Indians | 0.9 /100 | #247 | Tragic 30.8% |
| French Canadians | 0.9 /100 | #248 | Tragic 30.8% |
| Cape Verdeans | 0.8 /100 | #249 | Tragic 30.8% |
| Vietnamese | 0.7 /100 | #250 | Tragic 30.9% |
| Tlingit-Haida | 0.6 /100 | #251 | Tragic 30.9% |
| Alaska Natives | 0.6 /100 | #252 | Tragic 30.9% |
| Celtics | 0.6 /100 | #253 | Tragic 30.9% |
| Senegalese | 0.5 /100 | #254 | Tragic 31.0% |
| Belizeans | 0.5 /100 | #255 | Tragic 31.0% |
| Immigrants | West Indies | 0.4 /100 | #256 | Tragic 31.1% |
| Immigrants | Bahamas | 0.4 /100 | #257 | Tragic 31.1% |
| Immigrants | Caribbean | 0.4 /100 | #258 | Tragic 31.1% |
| Immigrants | Bangladesh | 0.4 /100 | #259 | Tragic 31.1% |
| Whites/Caucasians | 0.3 /100 | #260 | Tragic 31.2% |
| Immigrants | El Salvador | 0.3 /100 | #261 | Tragic 31.2% |
Demographics Similar to Inupiat by Single Mother Poverty
In terms of single mother poverty, the demographic groups most similar to Inupiat are Arab (29.0%, a difference of 0.020%), Costa Rican (29.0%, a difference of 0.10%), European (29.1%, a difference of 0.14%), Immigrants from Uruguay (29.1%, a difference of 0.16%), and New Zealander (29.1%, a difference of 0.26%).
| Demographics | Rating | Rank | Single Mother Poverty |
| Czechs | 68.4 /100 | #159 | Good 28.9% |
| Japanese | 68.0 /100 | #160 | Good 28.9% |
| Immigrants | Cambodia | 66.6 /100 | #161 | Good 28.9% |
| Scandinavians | 66.2 /100 | #162 | Good 28.9% |
| Immigrants | Nigeria | 65.9 /100 | #163 | Good 28.9% |
| Immigrants | Kenya | 65.9 /100 | #164 | Good 28.9% |
| Arabs | 60.7 /100 | #165 | Good 29.0% |
| Inupiat | 60.4 /100 | #166 | Good 29.0% |
| Costa Ricans | 58.4 /100 | #167 | Average 29.0% |
| Europeans | 57.6 /100 | #168 | Average 29.1% |
| Immigrants | Uruguay | 57.2 /100 | #169 | Average 29.1% |
| New Zealanders | 55.1 /100 | #170 | Average 29.1% |
| Puget Sound Salish | 55.1 /100 | #171 | Average 29.1% |
| Carpatho Rusyns | 53.8 /100 | #172 | Average 29.1% |
| British | 50.6 /100 | #173 | Average 29.2% |