Senegalese vs Scotch-Irish Poverty
COMPARE
Senegalese
Scotch-Irish
Poverty
Poverty Comparison
Senegalese
Scotch-Irish
15.3%
POVERTY
0.0/ 100
METRIC RATING
299th/ 347
METRIC RANK
12.2%
POVERTY
62.6/ 100
METRIC RATING
156th/ 347
METRIC RANK
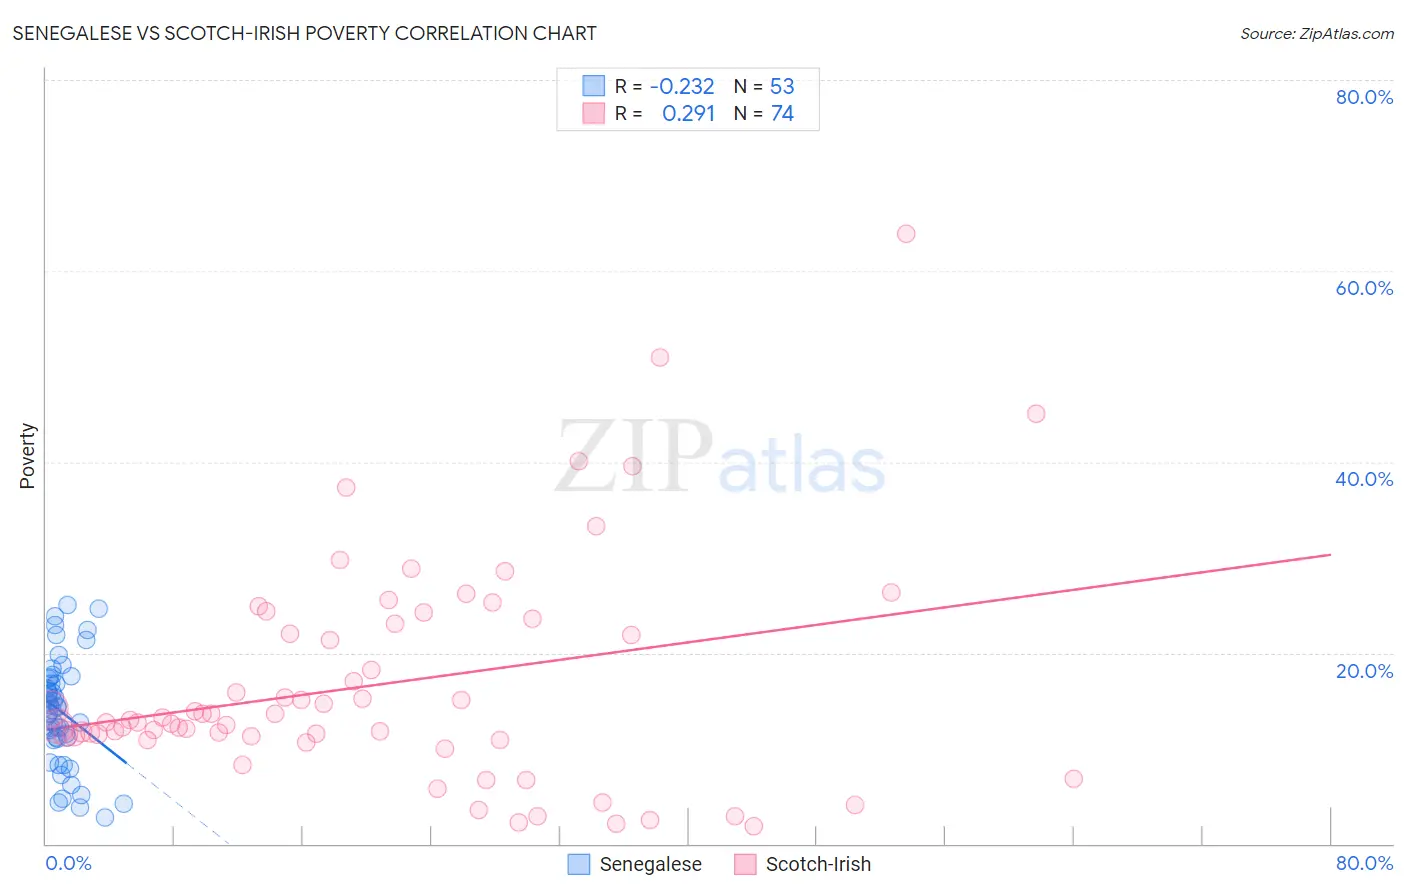
Senegalese vs Scotch-Irish Poverty Correlation Chart
The statistical analysis conducted on geographies consisting of 78,114,751 people shows a weak negative correlation between the proportion of Senegalese and poverty level in the United States with a correlation coefficient (R) of -0.232 and weighted average of 15.3%. Similarly, the statistical analysis conducted on geographies consisting of 548,217,294 people shows a weak positive correlation between the proportion of Scotch-Irish and poverty level in the United States with a correlation coefficient (R) of 0.291 and weighted average of 12.2%, a difference of 25.8%.
Poverty Correlation Summary
| Measurement | Senegalese | Scotch-Irish |
| Minimum | 2.8% | 1.8% |
| Maximum | 25.1% | 63.9% |
| Range | 22.3% | 62.1% |
| Mean | 13.8% | 16.7% |
| Median | 14.3% | 12.9% |
| Interquartile 25% (IQ1) | 11.0% | 11.3% |
| Interquartile 75% (IQ3) | 17.4% | 23.0% |
| Interquartile Range (IQR) | 6.4% | 11.7% |
| Standard Deviation (Sample) | 5.6% | 11.7% |
| Standard Deviation (Population) | 5.6% | 11.6% |
Similar Demographics by Poverty
Demographics Similar to Senegalese by Poverty
In terms of poverty, the demographic groups most similar to Senegalese are Immigrants from Senegal (15.3%, a difference of 0.090%), Immigrants from Bangladesh (15.3%, a difference of 0.24%), Hispanic or Latino (15.3%, a difference of 0.29%), Guatemalan (15.3%, a difference of 0.30%), and Immigrants from Central America (15.4%, a difference of 0.38%).
| Demographics | Rating | Rank | Poverty |
| Indonesians | 0.0 /100 | #292 | Tragic 15.1% |
| Immigrants | Zaire | 0.0 /100 | #293 | Tragic 15.1% |
| Blackfeet | 0.0 /100 | #294 | Tragic 15.2% |
| Guatemalans | 0.0 /100 | #295 | Tragic 15.3% |
| Hispanics or Latinos | 0.0 /100 | #296 | Tragic 15.3% |
| Immigrants | Bangladesh | 0.0 /100 | #297 | Tragic 15.3% |
| Immigrants | Senegal | 0.0 /100 | #298 | Tragic 15.3% |
| Senegalese | 0.0 /100 | #299 | Tragic 15.3% |
| Immigrants | Central America | 0.0 /100 | #300 | Tragic 15.4% |
| Bahamians | 0.0 /100 | #301 | Tragic 15.4% |
| Somalis | 0.0 /100 | #302 | Tragic 15.4% |
| Immigrants | Caribbean | 0.0 /100 | #303 | Tragic 15.5% |
| Immigrants | Mexico | 0.0 /100 | #304 | Tragic 15.5% |
| Immigrants | Guatemala | 0.0 /100 | #305 | Tragic 15.5% |
| Creek | 0.0 /100 | #306 | Tragic 15.6% |
Demographics Similar to Scotch-Irish by Poverty
In terms of poverty, the demographic groups most similar to Scotch-Irish are Costa Rican (12.2%, a difference of 0.040%), Taiwanese (12.2%, a difference of 0.080%), Hungarian (12.2%, a difference of 0.11%), Guamanian/Chamorro (12.1%, a difference of 0.14%), and Immigrants from Northern Africa (12.1%, a difference of 0.15%).
| Demographics | Rating | Rank | Poverty |
| Immigrants | Malaysia | 72.7 /100 | #149 | Good 12.0% |
| Immigrants | Kazakhstan | 72.3 /100 | #150 | Good 12.0% |
| Samoans | 71.9 /100 | #151 | Good 12.0% |
| Armenians | 67.6 /100 | #152 | Good 12.1% |
| Immigrants | Northern Africa | 63.9 /100 | #153 | Good 12.1% |
| Guamanians/Chamorros | 63.9 /100 | #154 | Good 12.1% |
| Hungarians | 63.6 /100 | #155 | Good 12.2% |
| Scotch-Irish | 62.6 /100 | #156 | Good 12.2% |
| Costa Ricans | 62.2 /100 | #157 | Good 12.2% |
| Taiwanese | 61.8 /100 | #158 | Good 12.2% |
| Pennsylvania Germans | 60.8 /100 | #159 | Good 12.2% |
| Immigrants | Nepal | 60.4 /100 | #160 | Good 12.2% |
| Immigrants | Fiji | 59.1 /100 | #161 | Average 12.2% |
| Ethiopians | 59.1 /100 | #162 | Average 12.2% |
| Immigrants | Ethiopia | 58.6 /100 | #163 | Average 12.2% |