Senegalese vs Lumbee Single Mother Households
COMPARE
Senegalese
Lumbee
Single Mother Households
Single Mother Households Comparison
Senegalese
Lumbee
8.2%
SINGLE MOTHER HOUSEHOLDS
0.0/ 100
METRIC RATING
318th/ 347
METRIC RANK
9.1%
SINGLE MOTHER HOUSEHOLDS
0.0/ 100
METRIC RATING
340th/ 347
METRIC RANK
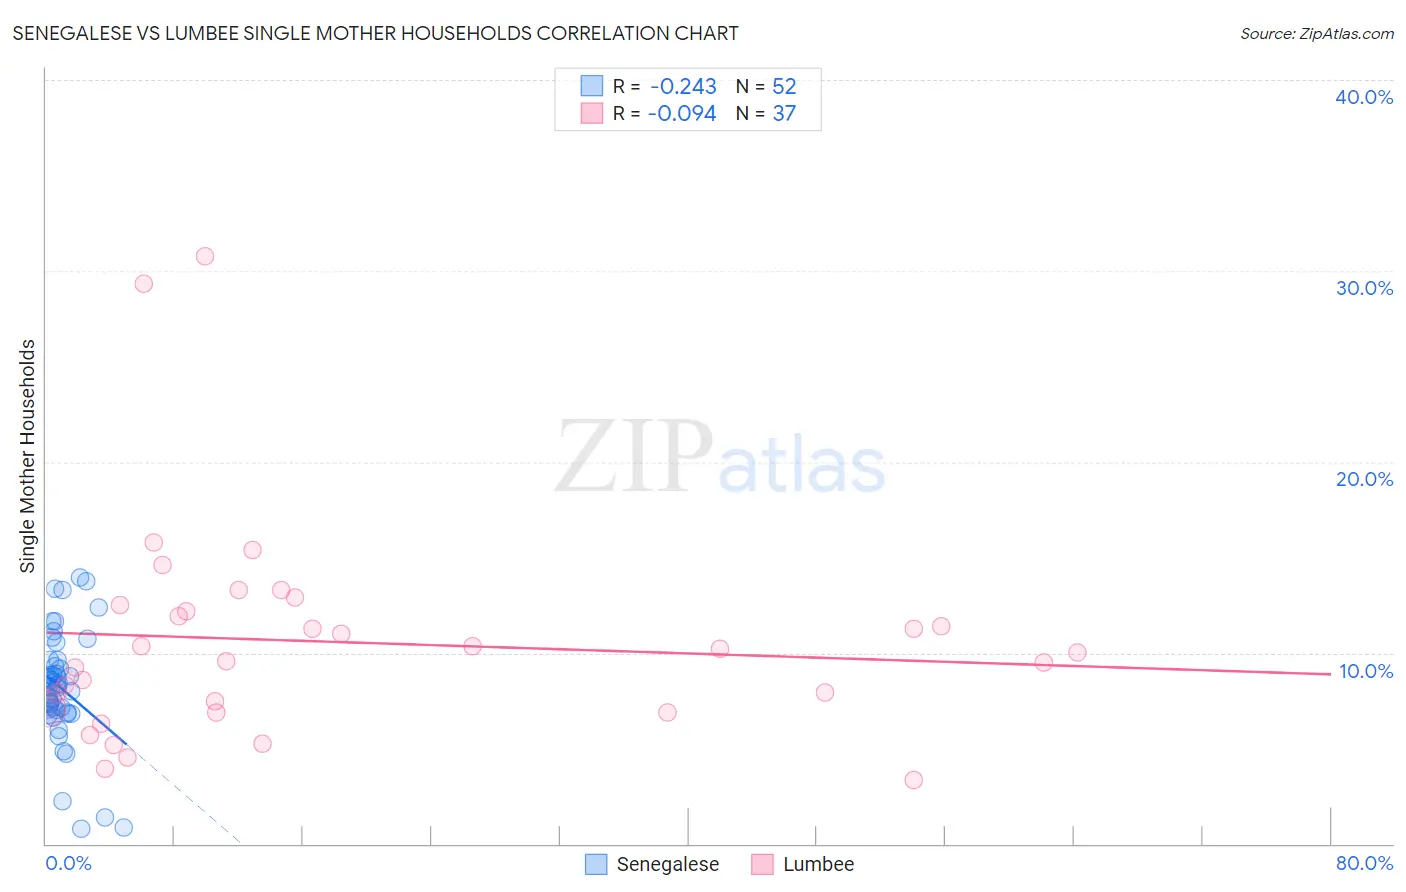
Senegalese vs Lumbee Single Mother Households Correlation Chart
The statistical analysis conducted on geographies consisting of 78,081,080 people shows a weak negative correlation between the proportion of Senegalese and percentage of single mother households in the United States with a correlation coefficient (R) of -0.243 and weighted average of 8.2%. Similarly, the statistical analysis conducted on geographies consisting of 92,236,041 people shows a slight negative correlation between the proportion of Lumbee and percentage of single mother households in the United States with a correlation coefficient (R) of -0.094 and weighted average of 9.1%, a difference of 10.5%.
Single Mother Households Correlation Summary
| Measurement | Senegalese | Lumbee |
| Minimum | 0.81% | 3.3% |
| Maximum | 13.9% | 30.7% |
| Range | 13.1% | 27.4% |
| Mean | 8.2% | 10.6% |
| Median | 8.2% | 10.0% |
| Interquartile 25% (IQ1) | 6.9% | 7.0% |
| Interquartile 75% (IQ3) | 9.5% | 12.3% |
| Interquartile Range (IQR) | 2.5% | 5.3% |
| Standard Deviation (Sample) | 2.9% | 5.7% |
| Standard Deviation (Population) | 2.9% | 5.6% |
Similar Demographics by Single Mother Households
Demographics Similar to Senegalese by Single Mother Households
In terms of single mother households, the demographic groups most similar to Senegalese are Jamaican (8.2%, a difference of 0.11%), Bahamian (8.3%, a difference of 0.23%), Immigrants from Senegal (8.3%, a difference of 0.47%), Pima (8.3%, a difference of 0.55%), and Immigrants from Honduras (8.2%, a difference of 0.56%).
| Demographics | Rating | Rank | Single Mother Households |
| Immigrants | Congo | 0.0 /100 | #311 | Tragic 8.1% |
| Bangladeshis | 0.0 /100 | #312 | Tragic 8.1% |
| Immigrants | Grenada | 0.0 /100 | #313 | Tragic 8.2% |
| Immigrants | Mexico | 0.0 /100 | #314 | Tragic 8.2% |
| Immigrants | Western Africa | 0.0 /100 | #315 | Tragic 8.2% |
| Africans | 0.0 /100 | #316 | Tragic 8.2% |
| Immigrants | Honduras | 0.0 /100 | #317 | Tragic 8.2% |
| Senegalese | 0.0 /100 | #318 | Tragic 8.2% |
| Jamaicans | 0.0 /100 | #319 | Tragic 8.2% |
| Bahamians | 0.0 /100 | #320 | Tragic 8.3% |
| Immigrants | Senegal | 0.0 /100 | #321 | Tragic 8.3% |
| Pima | 0.0 /100 | #322 | Tragic 8.3% |
| Haitians | 0.0 /100 | #323 | Tragic 8.3% |
| Immigrants | Jamaica | 0.0 /100 | #324 | Tragic 8.4% |
| Immigrants | Caribbean | 0.0 /100 | #325 | Tragic 8.4% |
Demographics Similar to Lumbee by Single Mother Households
In terms of single mother households, the demographic groups most similar to Lumbee are Tohono O'odham (9.1%, a difference of 0.36%), Menominee (9.2%, a difference of 0.68%), Dominican (9.2%, a difference of 0.89%), Black/African American (9.0%, a difference of 1.2%), and Cape Verdean (8.9%, a difference of 2.8%).
| Demographics | Rating | Rank | Single Mother Households |
| Liberians | 0.0 /100 | #333 | Tragic 8.6% |
| Immigrants | Liberia | 0.0 /100 | #334 | Tragic 8.7% |
| Immigrants | Dominica | 0.0 /100 | #335 | Tragic 8.7% |
| Puerto Ricans | 0.0 /100 | #336 | Tragic 8.7% |
| Navajo | 0.0 /100 | #337 | Tragic 8.8% |
| Cape Verdeans | 0.0 /100 | #338 | Tragic 8.9% |
| Blacks/African Americans | 0.0 /100 | #339 | Tragic 9.0% |
| Lumbee | 0.0 /100 | #340 | Tragic 9.1% |
| Tohono O'odham | 0.0 /100 | #341 | Tragic 9.1% |
| Menominee | 0.0 /100 | #342 | Tragic 9.2% |
| Dominicans | 0.0 /100 | #343 | Tragic 9.2% |
| Immigrants | Dominican Republic | 0.0 /100 | #344 | Tragic 9.5% |
| Immigrants | Cabo Verde | 0.0 /100 | #345 | Tragic 9.6% |
| Yuman | 0.0 /100 | #346 | Tragic 9.6% |
| Yup'ik | 0.0 /100 | #347 | Tragic 10.0% |