Senegalese vs Liberian Poverty
COMPARE
Senegalese
Liberian
Poverty
Poverty Comparison
Senegalese
Liberians
15.3%
POVERTY
0.0/ 100
METRIC RATING
299th/ 347
METRIC RANK
14.1%
POVERTY
0.2/ 100
METRIC RATING
247th/ 347
METRIC RANK
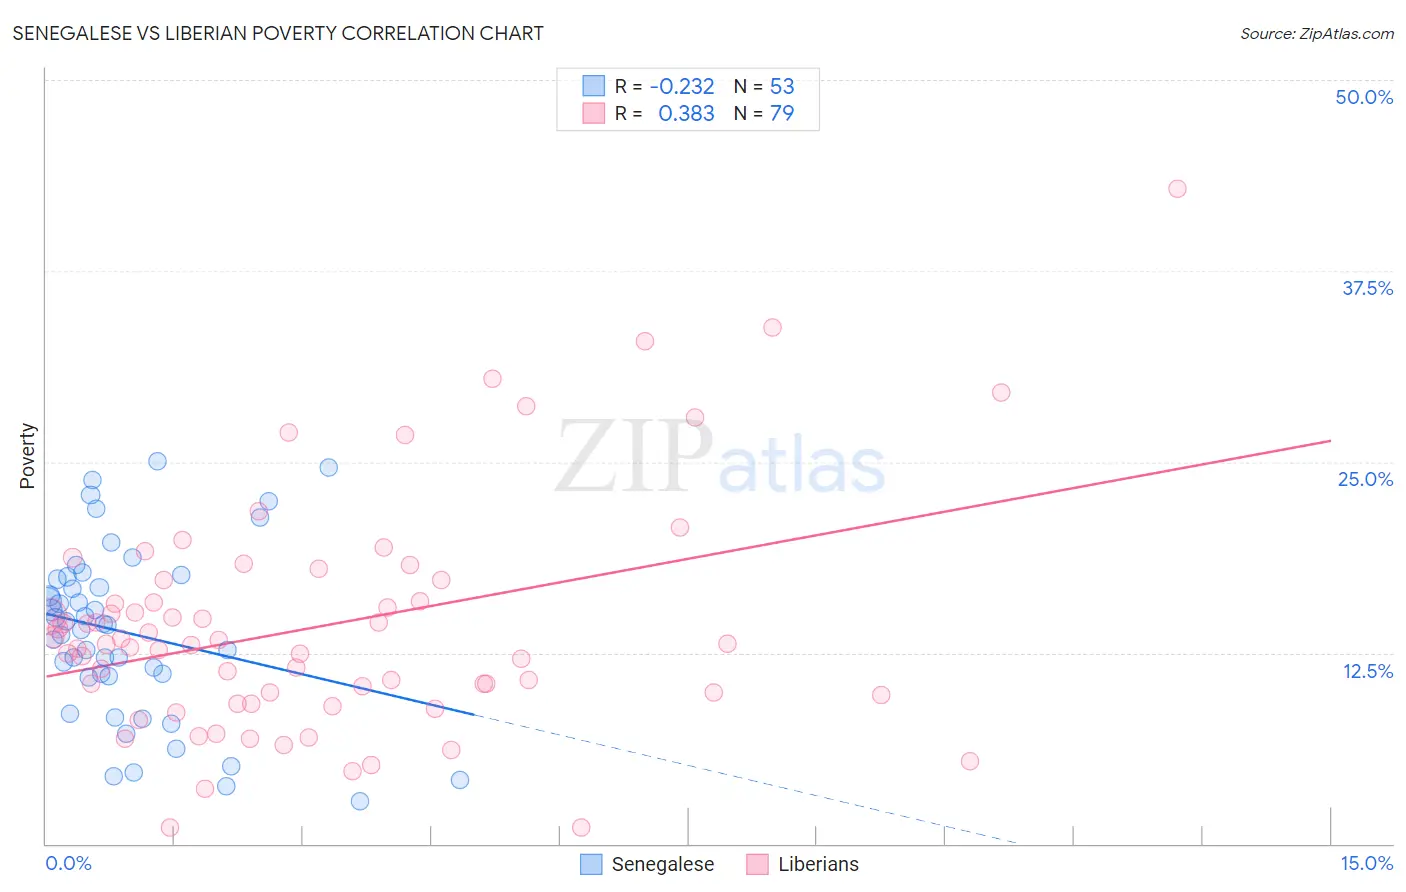
Senegalese vs Liberian Poverty Correlation Chart
The statistical analysis conducted on geographies consisting of 78,114,751 people shows a weak negative correlation between the proportion of Senegalese and poverty level in the United States with a correlation coefficient (R) of -0.232 and weighted average of 15.3%. Similarly, the statistical analysis conducted on geographies consisting of 118,042,560 people shows a mild positive correlation between the proportion of Liberians and poverty level in the United States with a correlation coefficient (R) of 0.383 and weighted average of 14.1%, a difference of 8.2%.
Poverty Correlation Summary
| Measurement | Senegalese | Liberian |
| Minimum | 2.8% | 1.0% |
| Maximum | 25.1% | 42.9% |
| Range | 22.3% | 41.9% |
| Mean | 13.8% | 14.3% |
| Median | 14.3% | 13.1% |
| Interquartile 25% (IQ1) | 11.0% | 9.8% |
| Interquartile 75% (IQ3) | 17.4% | 17.3% |
| Interquartile Range (IQR) | 6.4% | 7.5% |
| Standard Deviation (Sample) | 5.6% | 7.6% |
| Standard Deviation (Population) | 5.6% | 7.6% |
Similar Demographics by Poverty
Demographics Similar to Senegalese by Poverty
In terms of poverty, the demographic groups most similar to Senegalese are Immigrants from Senegal (15.3%, a difference of 0.090%), Immigrants from Bangladesh (15.3%, a difference of 0.24%), Hispanic or Latino (15.3%, a difference of 0.29%), Guatemalan (15.3%, a difference of 0.30%), and Immigrants from Central America (15.4%, a difference of 0.38%).
| Demographics | Rating | Rank | Poverty |
| Indonesians | 0.0 /100 | #292 | Tragic 15.1% |
| Immigrants | Zaire | 0.0 /100 | #293 | Tragic 15.1% |
| Blackfeet | 0.0 /100 | #294 | Tragic 15.2% |
| Guatemalans | 0.0 /100 | #295 | Tragic 15.3% |
| Hispanics or Latinos | 0.0 /100 | #296 | Tragic 15.3% |
| Immigrants | Bangladesh | 0.0 /100 | #297 | Tragic 15.3% |
| Immigrants | Senegal | 0.0 /100 | #298 | Tragic 15.3% |
| Senegalese | 0.0 /100 | #299 | Tragic 15.3% |
| Immigrants | Central America | 0.0 /100 | #300 | Tragic 15.4% |
| Bahamians | 0.0 /100 | #301 | Tragic 15.4% |
| Somalis | 0.0 /100 | #302 | Tragic 15.4% |
| Immigrants | Caribbean | 0.0 /100 | #303 | Tragic 15.5% |
| Immigrants | Mexico | 0.0 /100 | #304 | Tragic 15.5% |
| Immigrants | Guatemala | 0.0 /100 | #305 | Tragic 15.5% |
| Creek | 0.0 /100 | #306 | Tragic 15.6% |
Demographics Similar to Liberians by Poverty
In terms of poverty, the demographic groups most similar to Liberians are Immigrants from Western Africa (14.1%, a difference of 0.020%), Immigrants from Ghana (14.2%, a difference of 0.11%), Potawatomi (14.1%, a difference of 0.28%), Cree (14.2%, a difference of 0.41%), and Immigrants from Sudan (14.1%, a difference of 0.48%).
| Demographics | Rating | Rank | Poverty |
| Immigrants | Middle Africa | 0.4 /100 | #240 | Tragic 14.0% |
| Salvadorans | 0.4 /100 | #241 | Tragic 14.0% |
| Ecuadorians | 0.4 /100 | #242 | Tragic 14.0% |
| Sudanese | 0.3 /100 | #243 | Tragic 14.0% |
| Nepalese | 0.3 /100 | #244 | Tragic 14.0% |
| Immigrants | Sudan | 0.3 /100 | #245 | Tragic 14.1% |
| Potawatomi | 0.3 /100 | #246 | Tragic 14.1% |
| Liberians | 0.2 /100 | #247 | Tragic 14.1% |
| Immigrants | Western Africa | 0.2 /100 | #248 | Tragic 14.1% |
| Immigrants | Ghana | 0.2 /100 | #249 | Tragic 14.2% |
| Cree | 0.2 /100 | #250 | Tragic 14.2% |
| Immigrants | Burma/Myanmar | 0.2 /100 | #251 | Tragic 14.2% |
| Spanish American Indians | 0.2 /100 | #252 | Tragic 14.2% |
| Immigrants | Trinidad and Tobago | 0.2 /100 | #253 | Tragic 14.2% |
| Immigrants | El Salvador | 0.1 /100 | #254 | Tragic 14.3% |