Senegalese vs Immigrants from Laos Poverty
COMPARE
Senegalese
Immigrants from Laos
Poverty
Poverty Comparison
Senegalese
Immigrants from Laos
15.3%
POVERTY
0.0/ 100
METRIC RATING
299th/ 347
METRIC RANK
13.8%
POVERTY
0.7/ 100
METRIC RATING
234th/ 347
METRIC RANK
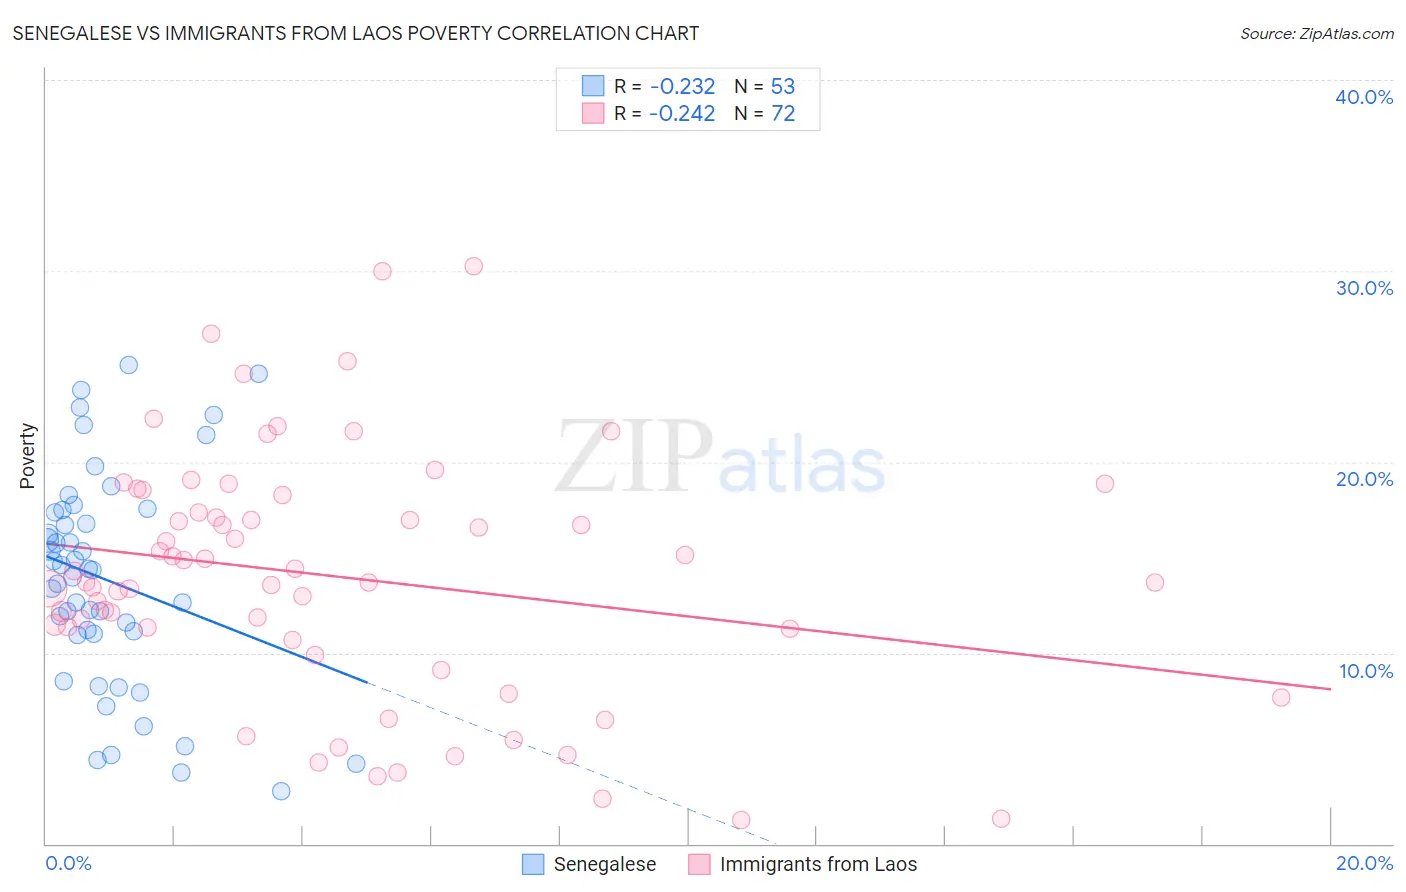
Senegalese vs Immigrants from Laos Poverty Correlation Chart
The statistical analysis conducted on geographies consisting of 78,114,751 people shows a weak negative correlation between the proportion of Senegalese and poverty level in the United States with a correlation coefficient (R) of -0.232 and weighted average of 15.3%. Similarly, the statistical analysis conducted on geographies consisting of 201,466,628 people shows a weak negative correlation between the proportion of Immigrants from Laos and poverty level in the United States with a correlation coefficient (R) of -0.242 and weighted average of 13.8%, a difference of 10.8%.
Poverty Correlation Summary
| Measurement | Senegalese | Immigrants from Laos |
| Minimum | 2.8% | 1.2% |
| Maximum | 25.1% | 30.2% |
| Range | 22.3% | 29.0% |
| Mean | 13.8% | 14.0% |
| Median | 14.3% | 13.7% |
| Interquartile 25% (IQ1) | 11.0% | 11.0% |
| Interquartile 75% (IQ3) | 17.4% | 17.8% |
| Interquartile Range (IQR) | 6.4% | 6.8% |
| Standard Deviation (Sample) | 5.6% | 6.5% |
| Standard Deviation (Population) | 5.6% | 6.4% |
Similar Demographics by Poverty
Demographics Similar to Senegalese by Poverty
In terms of poverty, the demographic groups most similar to Senegalese are Immigrants from Senegal (15.3%, a difference of 0.090%), Immigrants from Bangladesh (15.3%, a difference of 0.24%), Hispanic or Latino (15.3%, a difference of 0.29%), Guatemalan (15.3%, a difference of 0.30%), and Immigrants from Central America (15.4%, a difference of 0.38%).
| Demographics | Rating | Rank | Poverty |
| Indonesians | 0.0 /100 | #292 | Tragic 15.1% |
| Immigrants | Zaire | 0.0 /100 | #293 | Tragic 15.1% |
| Blackfeet | 0.0 /100 | #294 | Tragic 15.2% |
| Guatemalans | 0.0 /100 | #295 | Tragic 15.3% |
| Hispanics or Latinos | 0.0 /100 | #296 | Tragic 15.3% |
| Immigrants | Bangladesh | 0.0 /100 | #297 | Tragic 15.3% |
| Immigrants | Senegal | 0.0 /100 | #298 | Tragic 15.3% |
| Senegalese | 0.0 /100 | #299 | Tragic 15.3% |
| Immigrants | Central America | 0.0 /100 | #300 | Tragic 15.4% |
| Bahamians | 0.0 /100 | #301 | Tragic 15.4% |
| Somalis | 0.0 /100 | #302 | Tragic 15.4% |
| Immigrants | Caribbean | 0.0 /100 | #303 | Tragic 15.5% |
| Immigrants | Mexico | 0.0 /100 | #304 | Tragic 15.5% |
| Immigrants | Guatemala | 0.0 /100 | #305 | Tragic 15.5% |
| Creek | 0.0 /100 | #306 | Tragic 15.6% |
Demographics Similar to Immigrants from Laos by Poverty
In terms of poverty, the demographic groups most similar to Immigrants from Laos are Immigrants from Saudi Arabia (13.8%, a difference of 0.24%), Cuban (13.9%, a difference of 0.44%), Immigrants from Armenia (13.9%, a difference of 0.47%), Fijian (13.7%, a difference of 0.49%), and French American Indian (13.9%, a difference of 0.49%).
| Demographics | Rating | Rank | Poverty |
| Alaska Natives | 2.1 /100 | #227 | Tragic 13.5% |
| Immigrants | Nigeria | 1.7 /100 | #228 | Tragic 13.5% |
| Osage | 1.5 /100 | #229 | Tragic 13.6% |
| Alaskan Athabascans | 1.5 /100 | #230 | Tragic 13.6% |
| Nigerians | 1.4 /100 | #231 | Tragic 13.6% |
| Fijians | 0.8 /100 | #232 | Tragic 13.7% |
| Immigrants | Saudi Arabia | 0.8 /100 | #233 | Tragic 13.8% |
| Immigrants | Laos | 0.7 /100 | #234 | Tragic 13.8% |
| Cubans | 0.6 /100 | #235 | Tragic 13.9% |
| Immigrants | Armenia | 0.5 /100 | #236 | Tragic 13.9% |
| French American Indians | 0.5 /100 | #237 | Tragic 13.9% |
| Ghanaians | 0.5 /100 | #238 | Tragic 13.9% |
| Nicaraguans | 0.4 /100 | #239 | Tragic 13.9% |
| Immigrants | Middle Africa | 0.4 /100 | #240 | Tragic 14.0% |
| Salvadorans | 0.4 /100 | #241 | Tragic 14.0% |