Scottish vs Nonimmigrants Male Disability
COMPARE
Scottish
Nonimmigrants
Male Disability
Male Disability Comparison
Scottish
Nonimmigrants
12.8%
MALE DISABILITY
0.0/ 100
METRIC RATING
286th/ 347
METRIC RANK
12.9%
MALE DISABILITY
0.0/ 100
METRIC RATING
296th/ 347
METRIC RANK
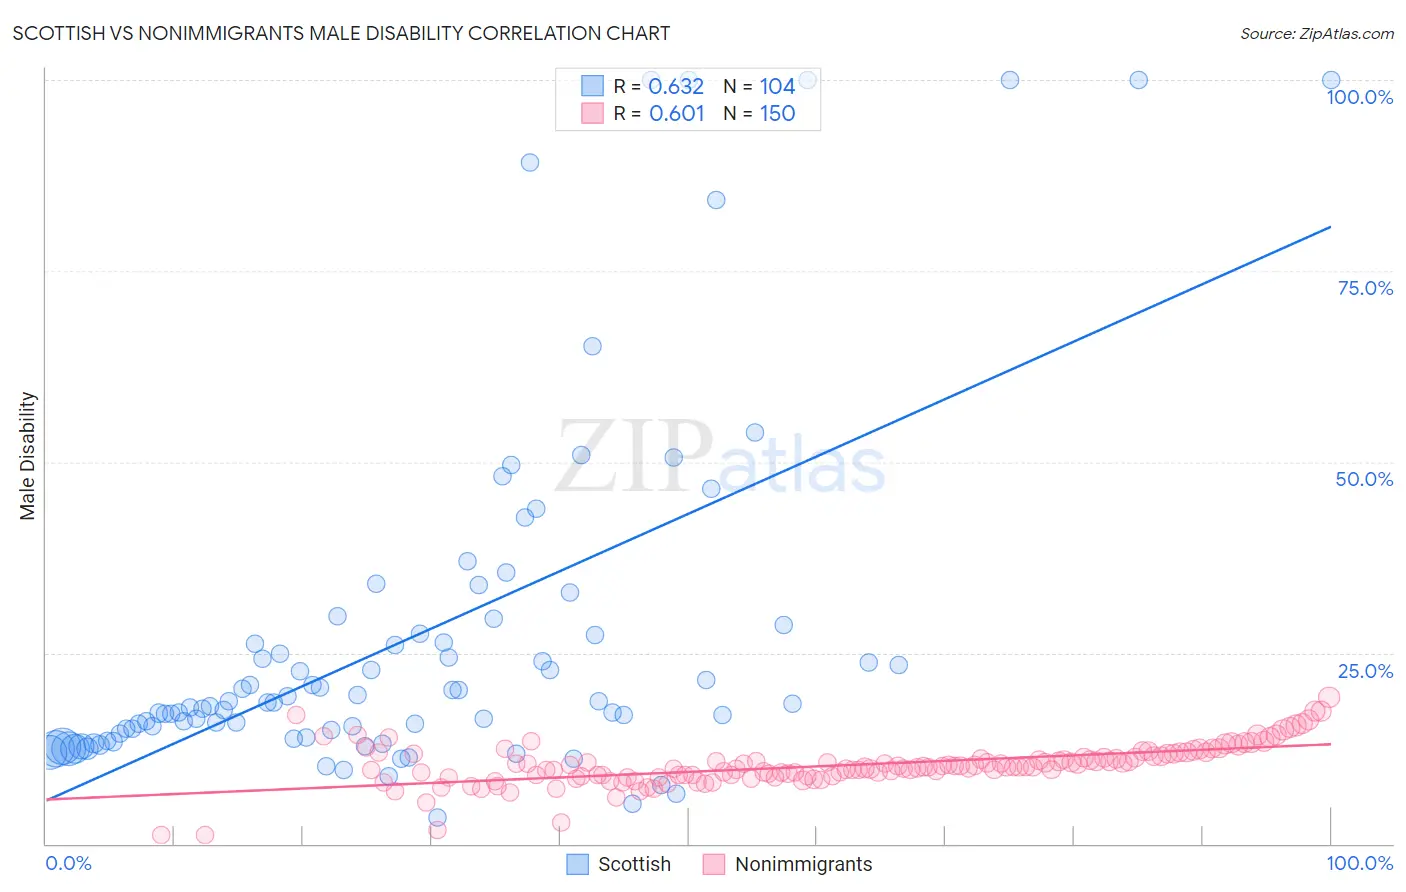
Scottish vs Nonimmigrants Male Disability Correlation Chart
The statistical analysis conducted on geographies consisting of 566,868,484 people shows a significant positive correlation between the proportion of Scottish and percentage of males with a disability in the United States with a correlation coefficient (R) of 0.632 and weighted average of 12.8%. Similarly, the statistical analysis conducted on geographies consisting of 584,663,642 people shows a significant positive correlation between the proportion of Nonimmigrants and percentage of males with a disability in the United States with a correlation coefficient (R) of 0.601 and weighted average of 12.9%, a difference of 1.4%.
Male Disability Correlation Summary
| Measurement | Scottish | Nonimmigrants |
| Minimum | 3.4% | 1.2% |
| Maximum | 100.0% | 19.2% |
| Range | 96.6% | 18.0% |
| Mean | 27.0% | 10.3% |
| Median | 18.4% | 10.0% |
| Interquartile 25% (IQ1) | 14.2% | 8.9% |
| Interquartile 75% (IQ3) | 27.4% | 11.5% |
| Interquartile Range (IQR) | 13.2% | 2.6% |
| Standard Deviation (Sample) | 23.1% | 2.7% |
| Standard Deviation (Population) | 23.0% | 2.7% |
Demographics Similar to Scottish and Nonimmigrants by Male Disability
In terms of male disability, the demographic groups most similar to Scottish are Welsh (12.7%, a difference of 0.050%), Spanish (12.7%, a difference of 0.060%), Cape Verdean (12.8%, a difference of 0.070%), Yup'ik (12.8%, a difference of 0.26%), and German (12.7%, a difference of 0.32%). Similarly, the demographic groups most similar to Nonimmigrants are Immigrants from Micronesia (12.9%, a difference of 0.070%), Inupiat (13.0%, a difference of 0.11%), Marshallese (12.9%, a difference of 0.16%), Pennsylvania German (13.0%, a difference of 0.31%), and Yaqui (12.9%, a difference of 0.40%).
| Demographics | Rating | Rank | Male Disability |
| Sioux | 0.0 /100 | #281 | Tragic 12.7% |
| Irish | 0.0 /100 | #282 | Tragic 12.7% |
| Germans | 0.0 /100 | #283 | Tragic 12.7% |
| Spanish | 0.0 /100 | #284 | Tragic 12.7% |
| Welsh | 0.0 /100 | #285 | Tragic 12.7% |
| Scottish | 0.0 /100 | #286 | Tragic 12.8% |
| Cape Verdeans | 0.0 /100 | #287 | Tragic 12.8% |
| Yup'ik | 0.0 /100 | #288 | Tragic 12.8% |
| Immigrants | Cabo Verde | 0.0 /100 | #289 | Tragic 12.8% |
| Pima | 0.0 /100 | #290 | Tragic 12.8% |
| Whites/Caucasians | 0.0 /100 | #291 | Tragic 12.8% |
| English | 0.0 /100 | #292 | Tragic 12.8% |
| Yaqui | 0.0 /100 | #293 | Tragic 12.9% |
| Marshallese | 0.0 /100 | #294 | Tragic 12.9% |
| Immigrants | Micronesia | 0.0 /100 | #295 | Tragic 12.9% |
| Immigrants | Nonimmigrants | 0.0 /100 | #296 | Tragic 12.9% |
| Inupiat | 0.0 /100 | #297 | Tragic 13.0% |
| Pennsylvania Germans | 0.0 /100 | #298 | Tragic 13.0% |
| Celtics | 0.0 /100 | #299 | Tragic 13.0% |
| Cheyenne | 0.0 /100 | #300 | Tragic 13.0% |
| French | 0.0 /100 | #301 | Tragic 13.0% |