Scottish vs Nonimmigrants Female Disability
COMPARE
Scottish
Nonimmigrants
Female Disability
Female Disability Comparison
Scottish
Nonimmigrants
13.0%
FEMALE DISABILITY
0.1/ 100
METRIC RATING
278th/ 347
METRIC RANK
13.4%
FEMALE DISABILITY
0.0/ 100
METRIC RATING
298th/ 347
METRIC RANK
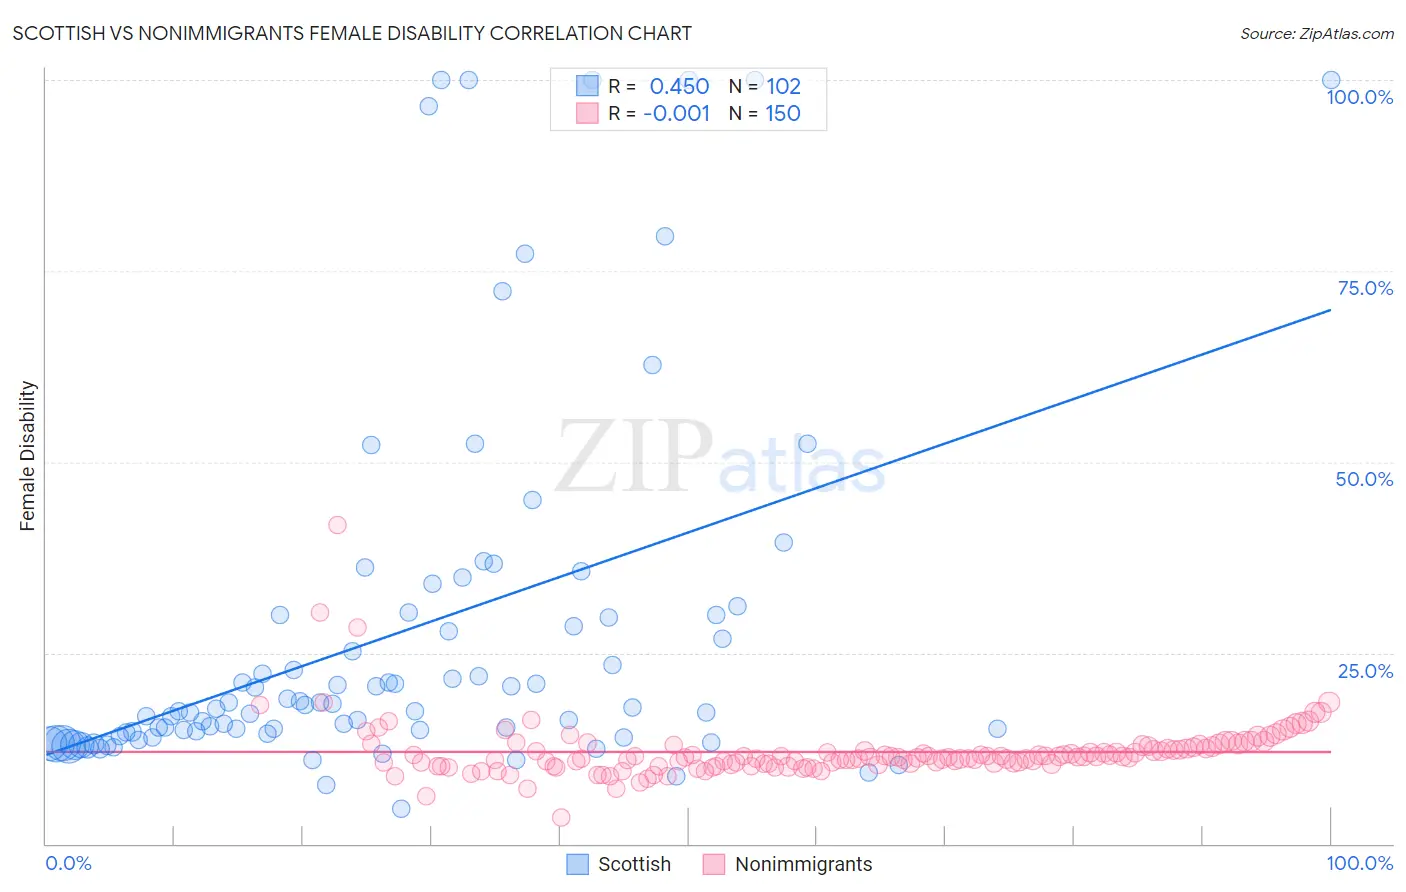
Scottish vs Nonimmigrants Female Disability Correlation Chart
The statistical analysis conducted on geographies consisting of 566,851,987 people shows a moderate positive correlation between the proportion of Scottish and percentage of females with a disability in the United States with a correlation coefficient (R) of 0.450 and weighted average of 13.0%. Similarly, the statistical analysis conducted on geographies consisting of 584,611,893 people shows no correlation between the proportion of Nonimmigrants and percentage of females with a disability in the United States with a correlation coefficient (R) of -0.001 and weighted average of 13.4%, a difference of 2.7%.
Female Disability Correlation Summary
| Measurement | Scottish | Nonimmigrants |
| Minimum | 4.6% | 3.5% |
| Maximum | 100.0% | 41.7% |
| Range | 95.4% | 38.2% |
| Mean | 27.6% | 12.0% |
| Median | 17.8% | 11.4% |
| Interquartile 25% (IQ1) | 14.4% | 10.4% |
| Interquartile 75% (IQ3) | 30.0% | 12.7% |
| Interquartile Range (IQR) | 15.6% | 2.2% |
| Standard Deviation (Sample) | 24.0% | 3.9% |
| Standard Deviation (Population) | 23.9% | 3.8% |
Demographics Similar to Scottish and Nonimmigrants by Female Disability
In terms of female disability, the demographic groups most similar to Scottish are Arapaho (13.0%, a difference of 0.24%), Irish (13.1%, a difference of 0.33%), U.S. Virgin Islander (13.1%, a difference of 0.36%), Welsh (13.1%, a difference of 0.44%), and English (13.1%, a difference of 0.45%). Similarly, the demographic groups most similar to Nonimmigrants are Slovak (13.3%, a difference of 0.30%), Nepalese (13.3%, a difference of 0.34%), French (13.3%, a difference of 0.47%), Celtic (13.3%, a difference of 0.68%), and Marshallese (13.3%, a difference of 0.73%).
| Demographics | Rating | Rank | Female Disability |
| Scottish | 0.1 /100 | #278 | Tragic 13.0% |
| Arapaho | 0.1 /100 | #279 | Tragic 13.0% |
| Irish | 0.1 /100 | #280 | Tragic 13.1% |
| U.S. Virgin Islanders | 0.1 /100 | #281 | Tragic 13.1% |
| Welsh | 0.0 /100 | #282 | Tragic 13.1% |
| English | 0.0 /100 | #283 | Tragic 13.1% |
| Hmong | 0.0 /100 | #284 | Tragic 13.1% |
| Bangladeshis | 0.0 /100 | #285 | Tragic 13.1% |
| Fijians | 0.0 /100 | #286 | Tragic 13.1% |
| Yaqui | 0.0 /100 | #287 | Tragic 13.2% |
| Whites/Caucasians | 0.0 /100 | #288 | Tragic 13.2% |
| Tlingit-Haida | 0.0 /100 | #289 | Tragic 13.2% |
| Immigrants | Yemen | 0.0 /100 | #290 | Tragic 13.2% |
| Shoshone | 0.0 /100 | #291 | Tragic 13.2% |
| Yakama | 0.0 /100 | #292 | Tragic 13.2% |
| Marshallese | 0.0 /100 | #293 | Tragic 13.3% |
| Celtics | 0.0 /100 | #294 | Tragic 13.3% |
| French | 0.0 /100 | #295 | Tragic 13.3% |
| Nepalese | 0.0 /100 | #296 | Tragic 13.3% |
| Slovaks | 0.0 /100 | #297 | Tragic 13.3% |
| Immigrants | Nonimmigrants | 0.0 /100 | #298 | Tragic 13.4% |