Scotch-Irish vs Lumbee Single Mother Poverty
COMPARE
Scotch-Irish
Lumbee
Single Mother Poverty
Single Mother Poverty Comparison
Scotch-Irish
Lumbee
31.5%
SINGLE MOTHER POVERTY
0.1/ 100
METRIC RATING
269th/ 347
METRIC RANK
43.2%
SINGLE MOTHER POVERTY
0.0/ 100
METRIC RATING
345th/ 347
METRIC RANK
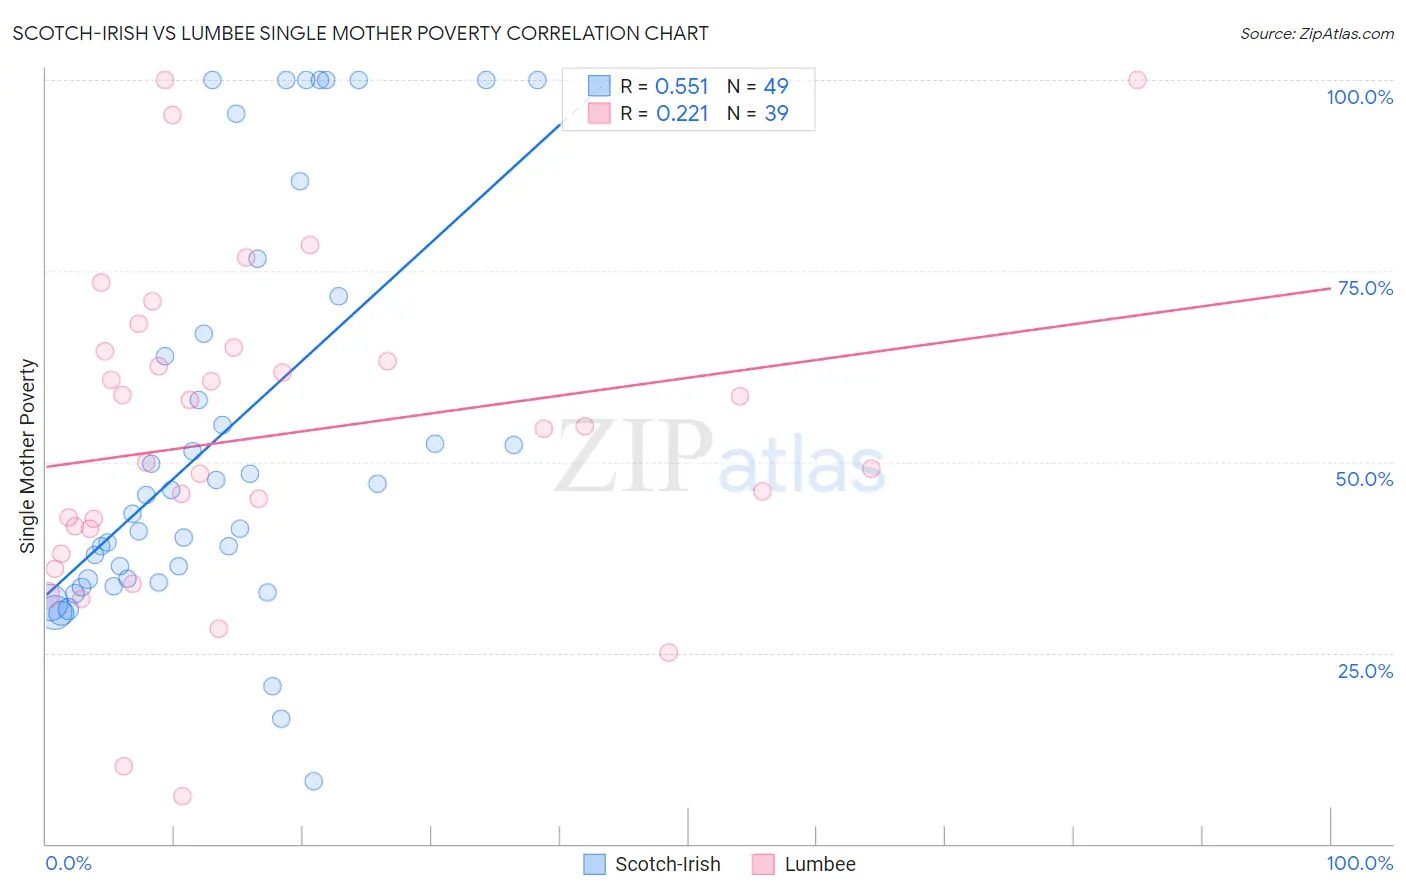
Scotch-Irish vs Lumbee Single Mother Poverty Correlation Chart
The statistical analysis conducted on geographies consisting of 524,083,922 people shows a substantial positive correlation between the proportion of Scotch-Irish and poverty level among single mothers in the United States with a correlation coefficient (R) of 0.551 and weighted average of 31.5%. Similarly, the statistical analysis conducted on geographies consisting of 91,530,918 people shows a weak positive correlation between the proportion of Lumbee and poverty level among single mothers in the United States with a correlation coefficient (R) of 0.221 and weighted average of 43.2%, a difference of 37.4%.
Single Mother Poverty Correlation Summary
| Measurement | Scotch-Irish | Lumbee |
| Minimum | 8.1% | 6.2% |
| Maximum | 100.0% | 100.0% |
| Range | 91.9% | 93.8% |
| Mean | 53.3% | 53.4% |
| Median | 45.6% | 54.4% |
| Interquartile 25% (IQ1) | 34.5% | 41.2% |
| Interquartile 75% (IQ3) | 69.2% | 64.5% |
| Interquartile Range (IQR) | 34.7% | 23.4% |
| Standard Deviation (Sample) | 26.2% | 21.1% |
| Standard Deviation (Population) | 25.9% | 20.9% |
Similar Demographics by Single Mother Poverty
Demographics Similar to Scotch-Irish by Single Mother Poverty
In terms of single mother poverty, the demographic groups most similar to Scotch-Irish are Immigrants from Senegal (31.5%, a difference of 0.040%), British West Indian (31.5%, a difference of 0.050%), Immigrants from Belize (31.4%, a difference of 0.22%), Immigrants from Cabo Verde (31.6%, a difference of 0.29%), and Immigrants from Micronesia (31.6%, a difference of 0.30%).
| Demographics | Rating | Rank | Single Mother Poverty |
| Hmong | 0.3 /100 | #262 | Tragic 31.2% |
| Bahamians | 0.2 /100 | #263 | Tragic 31.3% |
| Immigrants | Ecuador | 0.2 /100 | #264 | Tragic 31.3% |
| German Russians | 0.2 /100 | #265 | Tragic 31.3% |
| Sub-Saharan Africans | 0.2 /100 | #266 | Tragic 31.4% |
| Immigrants | Belize | 0.2 /100 | #267 | Tragic 31.4% |
| Immigrants | Senegal | 0.1 /100 | #268 | Tragic 31.5% |
| Scotch-Irish | 0.1 /100 | #269 | Tragic 31.5% |
| British West Indians | 0.1 /100 | #270 | Tragic 31.5% |
| Immigrants | Cabo Verde | 0.1 /100 | #271 | Tragic 31.6% |
| Immigrants | Micronesia | 0.1 /100 | #272 | Tragic 31.6% |
| Fijians | 0.1 /100 | #273 | Tragic 31.6% |
| Bangladeshis | 0.1 /100 | #274 | Tragic 31.7% |
| Central Americans | 0.1 /100 | #275 | Tragic 31.8% |
| Delaware | 0.0 /100 | #276 | Tragic 31.8% |
Demographics Similar to Lumbee by Single Mother Poverty
In terms of single mother poverty, the demographic groups most similar to Lumbee are Tohono O'odham (43.0%, a difference of 0.49%), Houma (43.5%, a difference of 0.62%), Puerto Rican (44.5%, a difference of 3.0%), Cajun (40.3%, a difference of 7.2%), and Navajo (40.2%, a difference of 7.5%).
| Demographics | Rating | Rank | Single Mother Poverty |
| Menominee | 0.0 /100 | #333 | Tragic 37.1% |
| Pueblo | 0.0 /100 | #334 | Tragic 37.2% |
| Yuman | 0.0 /100 | #335 | Tragic 37.8% |
| Cheyenne | 0.0 /100 | #336 | Tragic 38.5% |
| Immigrants | Yemen | 0.0 /100 | #337 | Tragic 38.5% |
| Pima | 0.0 /100 | #338 | Tragic 38.6% |
| Crow | 0.0 /100 | #339 | Tragic 38.6% |
| Sioux | 0.0 /100 | #340 | Tragic 38.8% |
| Colville | 0.0 /100 | #341 | Tragic 39.3% |
| Navajo | 0.0 /100 | #342 | Tragic 40.2% |
| Cajuns | 0.0 /100 | #343 | Tragic 40.3% |
| Tohono O'odham | 0.0 /100 | #344 | Tragic 43.0% |
| Lumbee | 0.0 /100 | #345 | Tragic 43.2% |
| Houma | 0.0 /100 | #346 | Tragic 43.5% |
| Puerto Ricans | 0.0 /100 | #347 | Tragic 44.5% |