Scotch-Irish vs Swiss Single Mother Poverty
COMPARE
Scotch-Irish
Swiss
Single Mother Poverty
Single Mother Poverty Comparison
Scotch-Irish
Swiss
31.5%
SINGLE MOTHER POVERTY
0.1/ 100
METRIC RATING
269th/ 347
METRIC RANK
29.7%
SINGLE MOTHER POVERTY
17.2/ 100
METRIC RATING
203rd/ 347
METRIC RANK
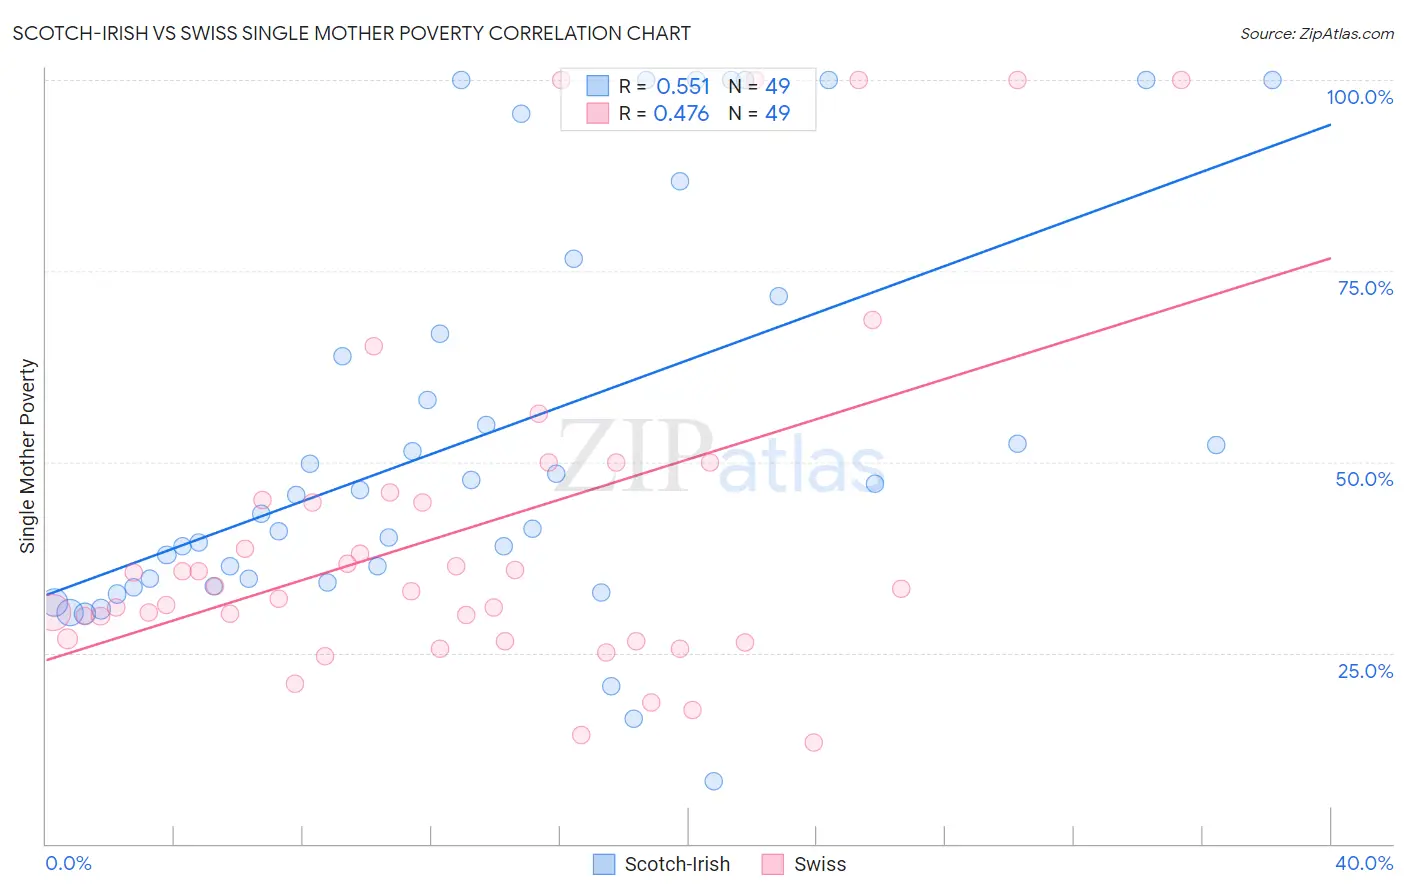
Scotch-Irish vs Swiss Single Mother Poverty Correlation Chart
The statistical analysis conducted on geographies consisting of 524,083,922 people shows a substantial positive correlation between the proportion of Scotch-Irish and poverty level among single mothers in the United States with a correlation coefficient (R) of 0.551 and weighted average of 31.5%. Similarly, the statistical analysis conducted on geographies consisting of 448,256,315 people shows a moderate positive correlation between the proportion of Swiss and poverty level among single mothers in the United States with a correlation coefficient (R) of 0.476 and weighted average of 29.7%, a difference of 5.9%.
Single Mother Poverty Correlation Summary
| Measurement | Scotch-Irish | Swiss |
| Minimum | 8.1% | 13.3% |
| Maximum | 100.0% | 100.0% |
| Range | 91.9% | 86.7% |
| Mean | 53.3% | 41.0% |
| Median | 45.6% | 33.3% |
| Interquartile 25% (IQ1) | 34.5% | 26.7% |
| Interquartile 75% (IQ3) | 69.2% | 45.5% |
| Interquartile Range (IQR) | 34.7% | 18.8% |
| Standard Deviation (Sample) | 26.2% | 23.1% |
| Standard Deviation (Population) | 25.9% | 22.8% |
Similar Demographics by Single Mother Poverty
Demographics Similar to Scotch-Irish by Single Mother Poverty
In terms of single mother poverty, the demographic groups most similar to Scotch-Irish are Immigrants from Senegal (31.5%, a difference of 0.040%), British West Indian (31.5%, a difference of 0.050%), Immigrants from Belize (31.4%, a difference of 0.22%), Immigrants from Cabo Verde (31.6%, a difference of 0.29%), and Immigrants from Micronesia (31.6%, a difference of 0.30%).
| Demographics | Rating | Rank | Single Mother Poverty |
| Hmong | 0.3 /100 | #262 | Tragic 31.2% |
| Bahamians | 0.2 /100 | #263 | Tragic 31.3% |
| Immigrants | Ecuador | 0.2 /100 | #264 | Tragic 31.3% |
| German Russians | 0.2 /100 | #265 | Tragic 31.3% |
| Sub-Saharan Africans | 0.2 /100 | #266 | Tragic 31.4% |
| Immigrants | Belize | 0.2 /100 | #267 | Tragic 31.4% |
| Immigrants | Senegal | 0.1 /100 | #268 | Tragic 31.5% |
| Scotch-Irish | 0.1 /100 | #269 | Tragic 31.5% |
| British West Indians | 0.1 /100 | #270 | Tragic 31.5% |
| Immigrants | Cabo Verde | 0.1 /100 | #271 | Tragic 31.6% |
| Immigrants | Micronesia | 0.1 /100 | #272 | Tragic 31.6% |
| Fijians | 0.1 /100 | #273 | Tragic 31.6% |
| Bangladeshis | 0.1 /100 | #274 | Tragic 31.7% |
| Central Americans | 0.1 /100 | #275 | Tragic 31.8% |
| Delaware | 0.0 /100 | #276 | Tragic 31.8% |
Demographics Similar to Swiss by Single Mother Poverty
In terms of single mother poverty, the demographic groups most similar to Swiss are Malaysian (29.7%, a difference of 0.020%), Immigrants (29.7%, a difference of 0.050%), Czechoslovakian (29.7%, a difference of 0.10%), Belgian (29.7%, a difference of 0.12%), and Immigrants from Haiti (29.7%, a difference of 0.12%).
| Demographics | Rating | Rank | Single Mother Poverty |
| Spanish American Indians | 23.4 /100 | #196 | Fair 29.6% |
| Immigrants | Jamaica | 22.0 /100 | #197 | Fair 29.6% |
| Trinidadians and Tobagonians | 21.7 /100 | #198 | Fair 29.6% |
| Cubans | 20.8 /100 | #199 | Fair 29.6% |
| Panamanians | 20.0 /100 | #200 | Fair 29.6% |
| Belgians | 18.8 /100 | #201 | Poor 29.7% |
| Malaysians | 17.4 /100 | #202 | Poor 29.7% |
| Swiss | 17.2 /100 | #203 | Poor 29.7% |
| Immigrants | Immigrants | 16.6 /100 | #204 | Poor 29.7% |
| Czechoslovakians | 16.1 /100 | #205 | Poor 29.7% |
| Immigrants | Haiti | 15.8 /100 | #206 | Poor 29.7% |
| Immigrants | Panama | 15.5 /100 | #207 | Poor 29.8% |
| Immigrants | Guyana | 14.7 /100 | #208 | Poor 29.8% |
| Irish | 13.9 /100 | #209 | Poor 29.8% |
| Haitians | 13.3 /100 | #210 | Poor 29.8% |