Scotch-Irish vs Lumbee Doctorate Degree
COMPARE
Scotch-Irish
Lumbee
Doctorate Degree
Doctorate Degree Comparison
Scotch-Irish
Lumbee
1.9%
DOCTORATE DEGREE
63.6/ 100
METRIC RATING
165th/ 347
METRIC RANK
1.1%
DOCTORATE DEGREE
0.0/ 100
METRIC RATING
345th/ 347
METRIC RANK
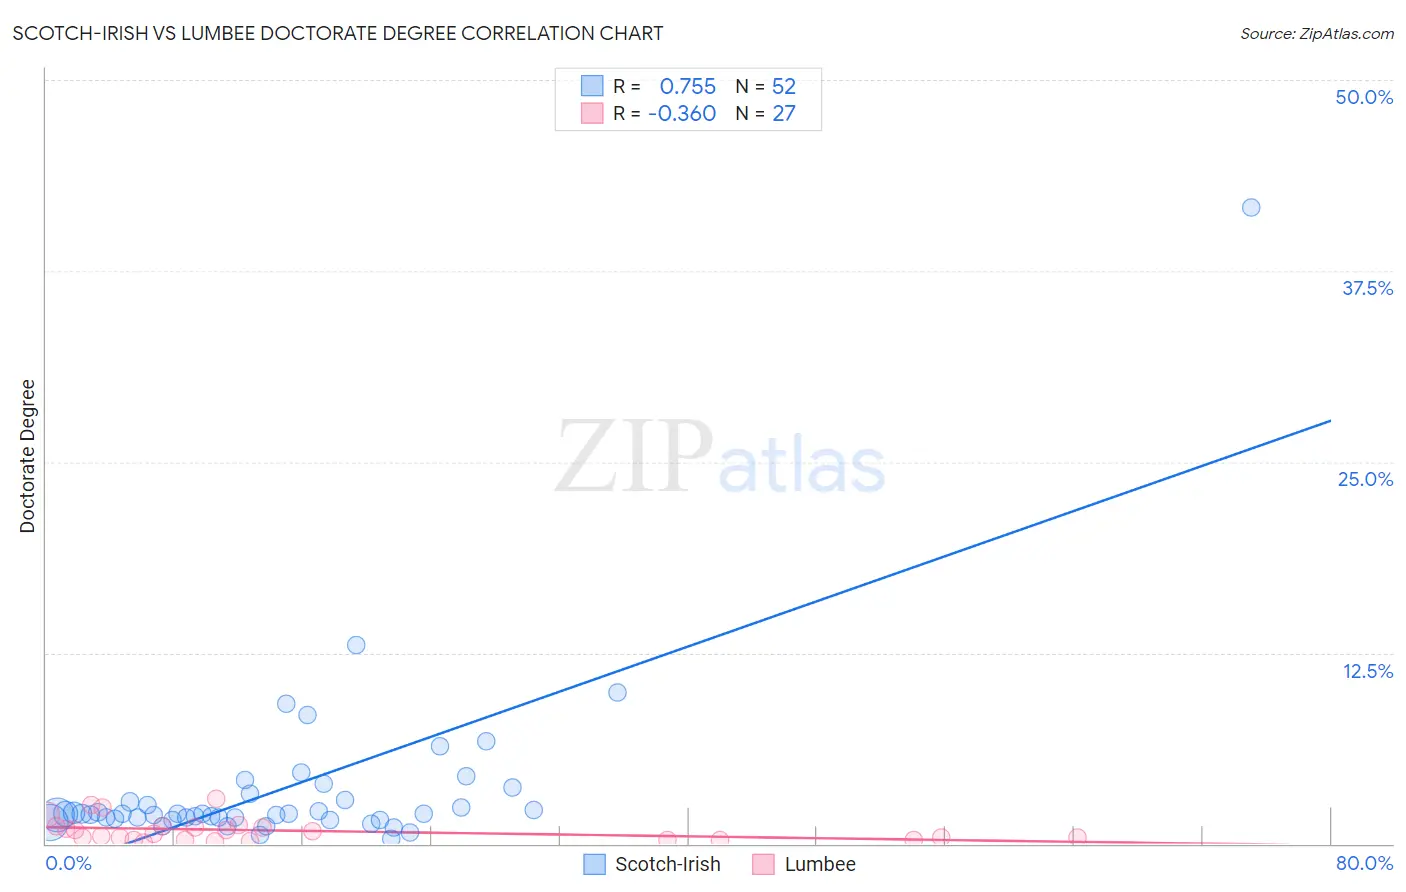
Scotch-Irish vs Lumbee Doctorate Degree Correlation Chart
The statistical analysis conducted on geographies consisting of 527,994,945 people shows a strong positive correlation between the proportion of Scotch-Irish and percentage of population with at least doctorate degree education in the United States with a correlation coefficient (R) of 0.755 and weighted average of 1.9%. Similarly, the statistical analysis conducted on geographies consisting of 91,789,296 people shows a mild negative correlation between the proportion of Lumbee and percentage of population with at least doctorate degree education in the United States with a correlation coefficient (R) of -0.360 and weighted average of 1.1%, a difference of 72.3%.
Doctorate Degree Correlation Summary
| Measurement | Scotch-Irish | Lumbee |
| Minimum | 0.30% | 0.076% |
| Maximum | 41.7% | 2.9% |
| Range | 41.4% | 2.8% |
| Mean | 3.6% | 0.86% |
| Median | 1.9% | 0.68% |
| Interquartile 25% (IQ1) | 1.7% | 0.26% |
| Interquartile 75% (IQ3) | 3.1% | 1.1% |
| Interquartile Range (IQR) | 1.4% | 0.87% |
| Standard Deviation (Sample) | 5.9% | 0.77% |
| Standard Deviation (Population) | 5.9% | 0.75% |
Similar Demographics by Doctorate Degree
Demographics Similar to Scotch-Irish by Doctorate Degree
In terms of doctorate degree, the demographic groups most similar to Scotch-Irish are Spaniard (1.9%, a difference of 0.020%), Macedonian (1.9%, a difference of 0.41%), Celtic (1.9%, a difference of 0.49%), Sri Lankan (1.9%, a difference of 0.51%), and Czech (1.9%, a difference of 0.58%).
| Demographics | Rating | Rank | Doctorate Degree |
| Hungarians | 71.7 /100 | #158 | Good 1.9% |
| Slovenes | 70.2 /100 | #159 | Good 1.9% |
| Welsh | 69.7 /100 | #160 | Good 1.9% |
| Immigrants | Middle Africa | 68.8 /100 | #161 | Good 1.9% |
| Irish | 67.5 /100 | #162 | Good 1.9% |
| Czechs | 67.3 /100 | #163 | Good 1.9% |
| Celtics | 66.7 /100 | #164 | Good 1.9% |
| Scotch-Irish | 63.6 /100 | #165 | Good 1.9% |
| Spaniards | 63.5 /100 | #166 | Good 1.9% |
| Macedonians | 60.9 /100 | #167 | Good 1.9% |
| Sri Lankans | 60.3 /100 | #168 | Good 1.9% |
| Vietnamese | 54.8 /100 | #169 | Average 1.9% |
| Costa Ricans | 53.3 /100 | #170 | Average 1.8% |
| Bermudans | 52.1 /100 | #171 | Average 1.8% |
| Belgians | 50.3 /100 | #172 | Average 1.8% |
Demographics Similar to Lumbee by Doctorate Degree
In terms of doctorate degree, the demographic groups most similar to Lumbee are Immigrants from Mexico (1.1%, a difference of 1.5%), Spanish American Indian (1.1%, a difference of 2.8%), Fijian (1.1%, a difference of 3.6%), Arapaho (1.2%, a difference of 7.1%), and Mexican (1.2%, a difference of 7.5%).
| Demographics | Rating | Rank | Doctorate Degree |
| Immigrants | Caribbean | 0.0 /100 | #333 | Tragic 1.3% |
| Immigrants | Dominican Republic | 0.0 /100 | #334 | Tragic 1.3% |
| Immigrants | Haiti | 0.0 /100 | #335 | Tragic 1.3% |
| Nepalese | 0.0 /100 | #336 | Tragic 1.3% |
| Bangladeshis | 0.0 /100 | #337 | Tragic 1.2% |
| Puget Sound Salish | 0.0 /100 | #338 | Tragic 1.2% |
| Immigrants | Central America | 0.0 /100 | #339 | Tragic 1.2% |
| Immigrants | Cuba | 0.0 /100 | #340 | Tragic 1.2% |
| Mexicans | 0.0 /100 | #341 | Tragic 1.2% |
| Arapaho | 0.0 /100 | #342 | Tragic 1.2% |
| Fijians | 0.0 /100 | #343 | Tragic 1.1% |
| Immigrants | Mexico | 0.0 /100 | #344 | Tragic 1.1% |
| Lumbee | 0.0 /100 | #345 | Tragic 1.1% |
| Spanish American Indians | 0.0 /100 | #346 | Tragic 1.1% |
| Houma | 0.0 /100 | #347 | Tragic 0.96% |