Scotch-Irish vs Immigrants from Singapore Single Mother Poverty
COMPARE
Scotch-Irish
Immigrants from Singapore
Single Mother Poverty
Single Mother Poverty Comparison
Scotch-Irish
Immigrants from Singapore
31.5%
SINGLE MOTHER POVERTY
0.1/ 100
METRIC RATING
269th/ 347
METRIC RANK
25.8%
SINGLE MOTHER POVERTY
100.0/ 100
METRIC RATING
14th/ 347
METRIC RANK
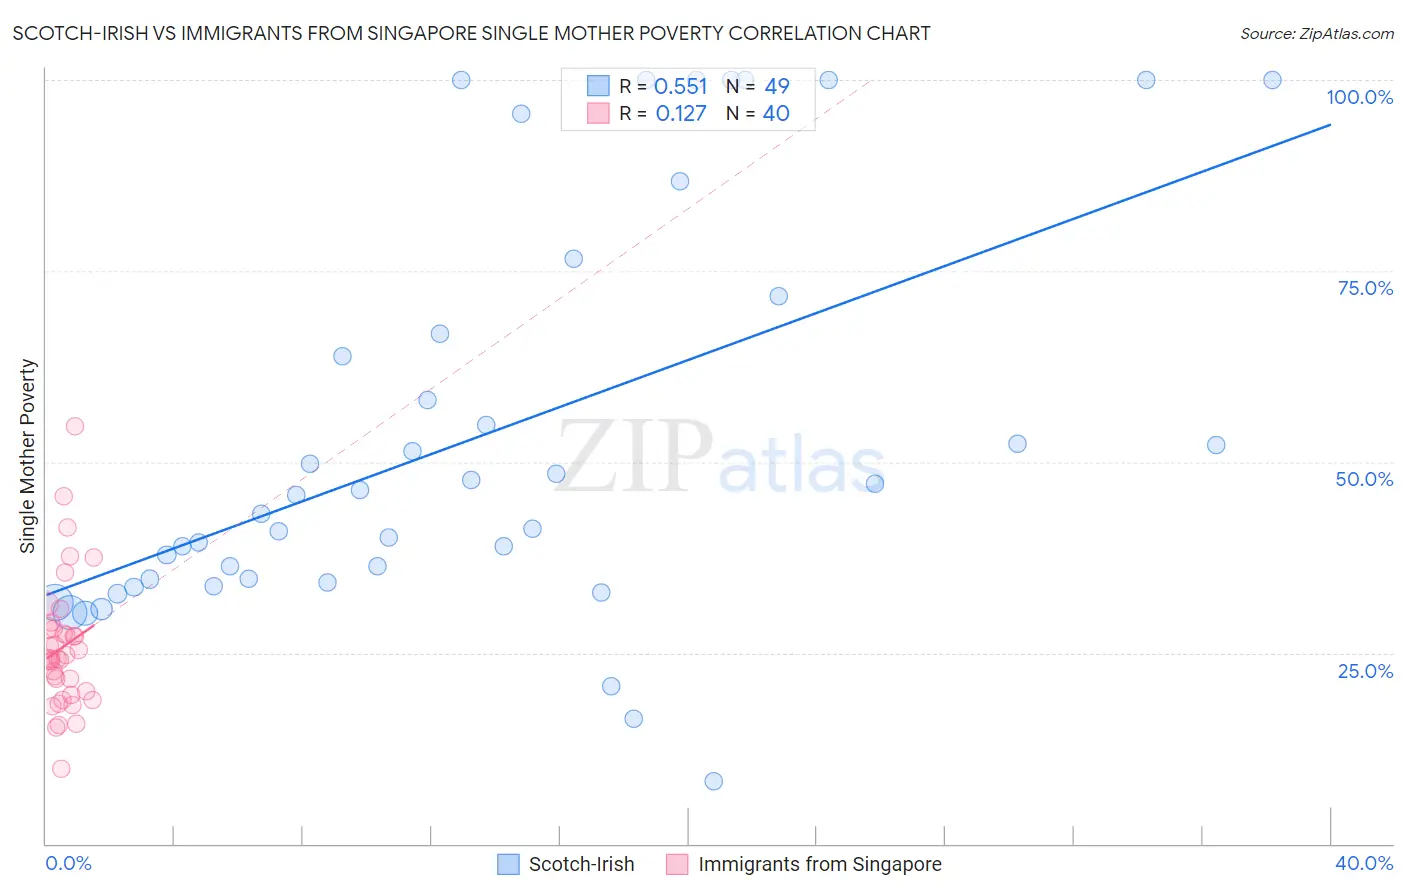
Scotch-Irish vs Immigrants from Singapore Single Mother Poverty Correlation Chart
The statistical analysis conducted on geographies consisting of 524,083,922 people shows a substantial positive correlation between the proportion of Scotch-Irish and poverty level among single mothers in the United States with a correlation coefficient (R) of 0.551 and weighted average of 31.5%. Similarly, the statistical analysis conducted on geographies consisting of 135,231,520 people shows a poor positive correlation between the proportion of Immigrants from Singapore and poverty level among single mothers in the United States with a correlation coefficient (R) of 0.127 and weighted average of 25.8%, a difference of 22.1%.
Single Mother Poverty Correlation Summary
| Measurement | Scotch-Irish | Immigrants from Singapore |
| Minimum | 8.1% | 9.9% |
| Maximum | 100.0% | 54.7% |
| Range | 91.9% | 44.8% |
| Mean | 53.3% | 25.8% |
| Median | 45.6% | 24.2% |
| Interquartile 25% (IQ1) | 34.5% | 19.7% |
| Interquartile 75% (IQ3) | 69.2% | 28.2% |
| Interquartile Range (IQR) | 34.7% | 8.5% |
| Standard Deviation (Sample) | 26.2% | 8.7% |
| Standard Deviation (Population) | 25.9% | 8.5% |
Similar Demographics by Single Mother Poverty
Demographics Similar to Scotch-Irish by Single Mother Poverty
In terms of single mother poverty, the demographic groups most similar to Scotch-Irish are Immigrants from Senegal (31.5%, a difference of 0.040%), British West Indian (31.5%, a difference of 0.050%), Immigrants from Belize (31.4%, a difference of 0.22%), Immigrants from Cabo Verde (31.6%, a difference of 0.29%), and Immigrants from Micronesia (31.6%, a difference of 0.30%).
| Demographics | Rating | Rank | Single Mother Poverty |
| Hmong | 0.3 /100 | #262 | Tragic 31.2% |
| Bahamians | 0.2 /100 | #263 | Tragic 31.3% |
| Immigrants | Ecuador | 0.2 /100 | #264 | Tragic 31.3% |
| German Russians | 0.2 /100 | #265 | Tragic 31.3% |
| Sub-Saharan Africans | 0.2 /100 | #266 | Tragic 31.4% |
| Immigrants | Belize | 0.2 /100 | #267 | Tragic 31.4% |
| Immigrants | Senegal | 0.1 /100 | #268 | Tragic 31.5% |
| Scotch-Irish | 0.1 /100 | #269 | Tragic 31.5% |
| British West Indians | 0.1 /100 | #270 | Tragic 31.5% |
| Immigrants | Cabo Verde | 0.1 /100 | #271 | Tragic 31.6% |
| Immigrants | Micronesia | 0.1 /100 | #272 | Tragic 31.6% |
| Fijians | 0.1 /100 | #273 | Tragic 31.6% |
| Bangladeshis | 0.1 /100 | #274 | Tragic 31.7% |
| Central Americans | 0.1 /100 | #275 | Tragic 31.8% |
| Delaware | 0.0 /100 | #276 | Tragic 31.8% |
Demographics Similar to Immigrants from Singapore by Single Mother Poverty
In terms of single mother poverty, the demographic groups most similar to Immigrants from Singapore are Indian (Asian) (25.8%, a difference of 0.15%), Immigrants from Ireland (25.8%, a difference of 0.18%), Bolivian (25.9%, a difference of 0.47%), Asian (26.0%, a difference of 0.65%), and Bhutanese (25.6%, a difference of 0.67%).
| Demographics | Rating | Rank | Single Mother Poverty |
| Chinese | 100.0 /100 | #7 | Exceptional 24.6% |
| Immigrants | Iran | 100.0 /100 | #8 | Exceptional 25.1% |
| Immigrants | Lithuania | 100.0 /100 | #9 | Exceptional 25.2% |
| Immigrants | South Central Asia | 100.0 /100 | #10 | Exceptional 25.3% |
| Iranians | 100.0 /100 | #11 | Exceptional 25.5% |
| Bhutanese | 100.0 /100 | #12 | Exceptional 25.6% |
| Indians (Asian) | 100.0 /100 | #13 | Exceptional 25.8% |
| Immigrants | Singapore | 100.0 /100 | #14 | Exceptional 25.8% |
| Immigrants | Ireland | 100.0 /100 | #15 | Exceptional 25.8% |
| Bolivians | 100.0 /100 | #16 | Exceptional 25.9% |
| Asians | 100.0 /100 | #17 | Exceptional 26.0% |
| Immigrants | Pakistan | 100.0 /100 | #18 | Exceptional 26.0% |
| Immigrants | Eastern Asia | 100.0 /100 | #19 | Exceptional 26.1% |
| Immigrants | China | 100.0 /100 | #20 | Exceptional 26.1% |
| Immigrants | Bolivia | 100.0 /100 | #21 | Exceptional 26.2% |