Scotch-Irish vs Osage Single Mother Poverty
COMPARE
Scotch-Irish
Osage
Single Mother Poverty
Single Mother Poverty Comparison
Scotch-Irish
Osage
31.5%
SINGLE MOTHER POVERTY
0.1/ 100
METRIC RATING
269th/ 347
METRIC RANK
32.6%
SINGLE MOTHER POVERTY
0.0/ 100
METRIC RATING
290th/ 347
METRIC RANK
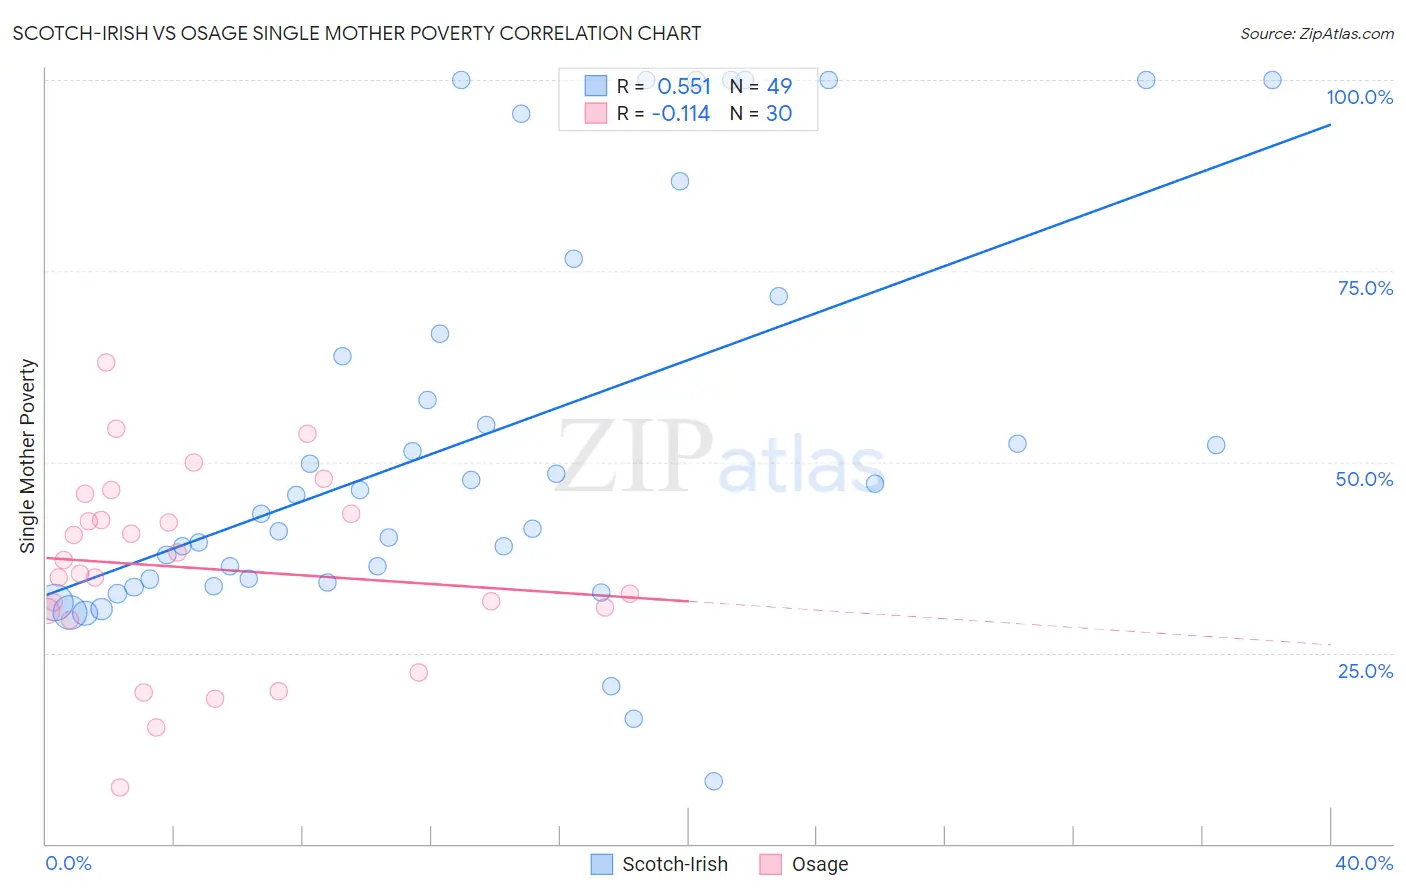
Scotch-Irish vs Osage Single Mother Poverty Correlation Chart
The statistical analysis conducted on geographies consisting of 524,083,922 people shows a substantial positive correlation between the proportion of Scotch-Irish and poverty level among single mothers in the United States with a correlation coefficient (R) of 0.551 and weighted average of 31.5%. Similarly, the statistical analysis conducted on geographies consisting of 91,278,807 people shows a poor negative correlation between the proportion of Osage and poverty level among single mothers in the United States with a correlation coefficient (R) of -0.114 and weighted average of 32.6%, a difference of 3.6%.
Single Mother Poverty Correlation Summary
| Measurement | Scotch-Irish | Osage |
| Minimum | 8.1% | 7.3% |
| Maximum | 100.0% | 63.0% |
| Range | 91.9% | 55.7% |
| Mean | 53.3% | 36.1% |
| Median | 45.6% | 36.3% |
| Interquartile 25% (IQ1) | 34.5% | 30.5% |
| Interquartile 75% (IQ3) | 69.2% | 43.2% |
| Interquartile Range (IQR) | 34.7% | 12.7% |
| Standard Deviation (Sample) | 26.2% | 12.5% |
| Standard Deviation (Population) | 25.9% | 12.3% |
Similar Demographics by Single Mother Poverty
Demographics Similar to Scotch-Irish by Single Mother Poverty
In terms of single mother poverty, the demographic groups most similar to Scotch-Irish are Immigrants from Senegal (31.5%, a difference of 0.040%), British West Indian (31.5%, a difference of 0.050%), Immigrants from Belize (31.4%, a difference of 0.22%), Immigrants from Cabo Verde (31.6%, a difference of 0.29%), and Immigrants from Micronesia (31.6%, a difference of 0.30%).
| Demographics | Rating | Rank | Single Mother Poverty |
| Hmong | 0.3 /100 | #262 | Tragic 31.2% |
| Bahamians | 0.2 /100 | #263 | Tragic 31.3% |
| Immigrants | Ecuador | 0.2 /100 | #264 | Tragic 31.3% |
| German Russians | 0.2 /100 | #265 | Tragic 31.3% |
| Sub-Saharan Africans | 0.2 /100 | #266 | Tragic 31.4% |
| Immigrants | Belize | 0.2 /100 | #267 | Tragic 31.4% |
| Immigrants | Senegal | 0.1 /100 | #268 | Tragic 31.5% |
| Scotch-Irish | 0.1 /100 | #269 | Tragic 31.5% |
| British West Indians | 0.1 /100 | #270 | Tragic 31.5% |
| Immigrants | Cabo Verde | 0.1 /100 | #271 | Tragic 31.6% |
| Immigrants | Micronesia | 0.1 /100 | #272 | Tragic 31.6% |
| Fijians | 0.1 /100 | #273 | Tragic 31.6% |
| Bangladeshis | 0.1 /100 | #274 | Tragic 31.7% |
| Central Americans | 0.1 /100 | #275 | Tragic 31.8% |
| Delaware | 0.0 /100 | #276 | Tragic 31.8% |
Demographics Similar to Osage by Single Mother Poverty
In terms of single mother poverty, the demographic groups most similar to Osage are U.S. Virgin Islander (32.6%, a difference of 0.11%), Somali (32.6%, a difference of 0.14%), Immigrants from Dominica (32.5%, a difference of 0.37%), Yup'ik (32.5%, a difference of 0.49%), and Immigrants from Latin America (32.4%, a difference of 0.57%).
| Demographics | Rating | Rank | Single Mother Poverty |
| Spanish Americans | 0.0 /100 | #283 | Tragic 32.3% |
| Indonesians | 0.0 /100 | #284 | Tragic 32.4% |
| Immigrants | Latin America | 0.0 /100 | #285 | Tragic 32.4% |
| Yup'ik | 0.0 /100 | #286 | Tragic 32.5% |
| Immigrants | Dominica | 0.0 /100 | #287 | Tragic 32.5% |
| Somalis | 0.0 /100 | #288 | Tragic 32.6% |
| U.S. Virgin Islanders | 0.0 /100 | #289 | Tragic 32.6% |
| Osage | 0.0 /100 | #290 | Tragic 32.6% |
| Guatemalans | 0.0 /100 | #291 | Tragic 32.9% |
| Shoshone | 0.0 /100 | #292 | Tragic 32.9% |
| Aleuts | 0.0 /100 | #293 | Tragic 32.9% |
| French American Indians | 0.0 /100 | #294 | Tragic 33.1% |
| Yaqui | 0.0 /100 | #295 | Tragic 33.1% |
| Blackfeet | 0.0 /100 | #296 | Tragic 33.2% |
| Pennsylvania Germans | 0.0 /100 | #297 | Tragic 33.2% |