Belizean vs Lumbee Single Mother Poverty
COMPARE
Belizean
Lumbee
Single Mother Poverty
Single Mother Poverty Comparison
Belizeans
Lumbee
31.0%
SINGLE MOTHER POVERTY
0.5/ 100
METRIC RATING
255th/ 347
METRIC RANK
43.2%
SINGLE MOTHER POVERTY
0.0/ 100
METRIC RATING
345th/ 347
METRIC RANK
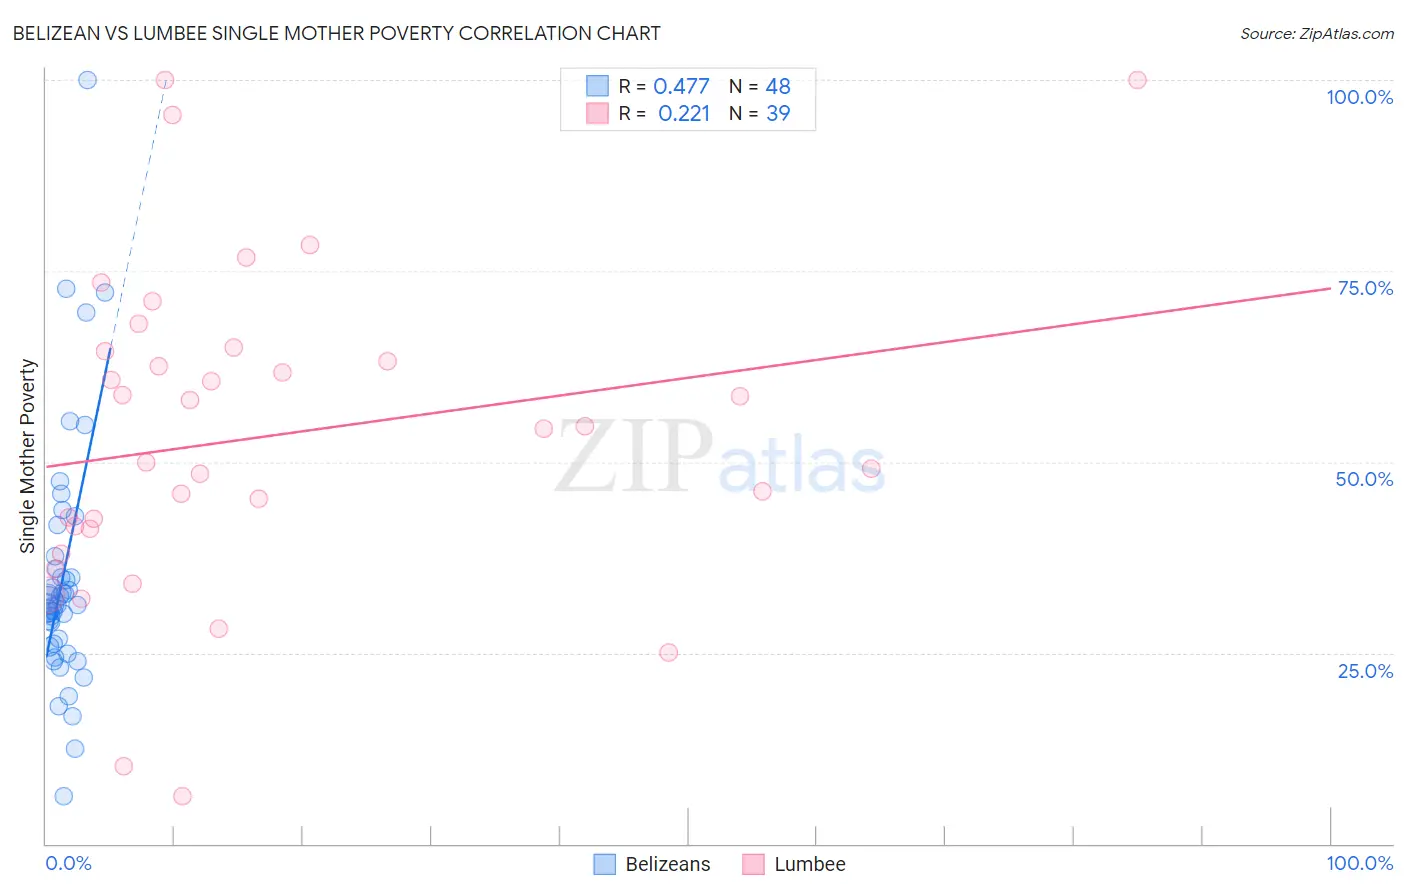
Belizean vs Lumbee Single Mother Poverty Correlation Chart
The statistical analysis conducted on geographies consisting of 143,389,155 people shows a moderate positive correlation between the proportion of Belizeans and poverty level among single mothers in the United States with a correlation coefficient (R) of 0.477 and weighted average of 31.0%. Similarly, the statistical analysis conducted on geographies consisting of 91,530,918 people shows a weak positive correlation between the proportion of Lumbee and poverty level among single mothers in the United States with a correlation coefficient (R) of 0.221 and weighted average of 43.2%, a difference of 39.5%.
Single Mother Poverty Correlation Summary
| Measurement | Belizean | Lumbee |
| Minimum | 6.2% | 6.2% |
| Maximum | 100.0% | 100.0% |
| Range | 93.8% | 93.8% |
| Mean | 35.0% | 53.4% |
| Median | 31.4% | 54.4% |
| Interquartile 25% (IQ1) | 26.0% | 41.2% |
| Interquartile 75% (IQ3) | 36.8% | 64.5% |
| Interquartile Range (IQR) | 10.9% | 23.4% |
| Standard Deviation (Sample) | 16.6% | 21.1% |
| Standard Deviation (Population) | 16.5% | 20.9% |
Similar Demographics by Single Mother Poverty
Demographics Similar to Belizeans by Single Mother Poverty
In terms of single mother poverty, the demographic groups most similar to Belizeans are Senegalese (31.0%, a difference of 0.11%), Immigrants from West Indies (31.1%, a difference of 0.21%), Celtic (30.9%, a difference of 0.25%), Immigrants from Bahamas (31.1%, a difference of 0.26%), and Alaska Native (30.9%, a difference of 0.28%).
| Demographics | Rating | Rank | Single Mother Poverty |
| French Canadians | 0.9 /100 | #248 | Tragic 30.8% |
| Cape Verdeans | 0.8 /100 | #249 | Tragic 30.8% |
| Vietnamese | 0.7 /100 | #250 | Tragic 30.9% |
| Tlingit-Haida | 0.6 /100 | #251 | Tragic 30.9% |
| Alaska Natives | 0.6 /100 | #252 | Tragic 30.9% |
| Celtics | 0.6 /100 | #253 | Tragic 30.9% |
| Senegalese | 0.5 /100 | #254 | Tragic 31.0% |
| Belizeans | 0.5 /100 | #255 | Tragic 31.0% |
| Immigrants | West Indies | 0.4 /100 | #256 | Tragic 31.1% |
| Immigrants | Bahamas | 0.4 /100 | #257 | Tragic 31.1% |
| Immigrants | Caribbean | 0.4 /100 | #258 | Tragic 31.1% |
| Immigrants | Bangladesh | 0.4 /100 | #259 | Tragic 31.1% |
| Whites/Caucasians | 0.3 /100 | #260 | Tragic 31.2% |
| Immigrants | El Salvador | 0.3 /100 | #261 | Tragic 31.2% |
| Hmong | 0.3 /100 | #262 | Tragic 31.2% |
Demographics Similar to Lumbee by Single Mother Poverty
In terms of single mother poverty, the demographic groups most similar to Lumbee are Tohono O'odham (43.0%, a difference of 0.49%), Houma (43.5%, a difference of 0.62%), Puerto Rican (44.5%, a difference of 3.0%), Cajun (40.3%, a difference of 7.2%), and Navajo (40.2%, a difference of 7.5%).
| Demographics | Rating | Rank | Single Mother Poverty |
| Menominee | 0.0 /100 | #333 | Tragic 37.1% |
| Pueblo | 0.0 /100 | #334 | Tragic 37.2% |
| Yuman | 0.0 /100 | #335 | Tragic 37.8% |
| Cheyenne | 0.0 /100 | #336 | Tragic 38.5% |
| Immigrants | Yemen | 0.0 /100 | #337 | Tragic 38.5% |
| Pima | 0.0 /100 | #338 | Tragic 38.6% |
| Crow | 0.0 /100 | #339 | Tragic 38.6% |
| Sioux | 0.0 /100 | #340 | Tragic 38.8% |
| Colville | 0.0 /100 | #341 | Tragic 39.3% |
| Navajo | 0.0 /100 | #342 | Tragic 40.2% |
| Cajuns | 0.0 /100 | #343 | Tragic 40.3% |
| Tohono O'odham | 0.0 /100 | #344 | Tragic 43.0% |
| Lumbee | 0.0 /100 | #345 | Tragic 43.2% |
| Houma | 0.0 /100 | #346 | Tragic 43.5% |
| Puerto Ricans | 0.0 /100 | #347 | Tragic 44.5% |