Immigrants from Norway vs Lumbee Single Mother Poverty
COMPARE
Immigrants from Norway
Lumbee
Single Mother Poverty
Single Mother Poverty Comparison
Immigrants from Norway
Lumbee
29.3%
SINGLE MOTHER POVERTY
41.5/ 100
METRIC RATING
180th/ 347
METRIC RANK
43.2%
SINGLE MOTHER POVERTY
0.0/ 100
METRIC RATING
345th/ 347
METRIC RANK
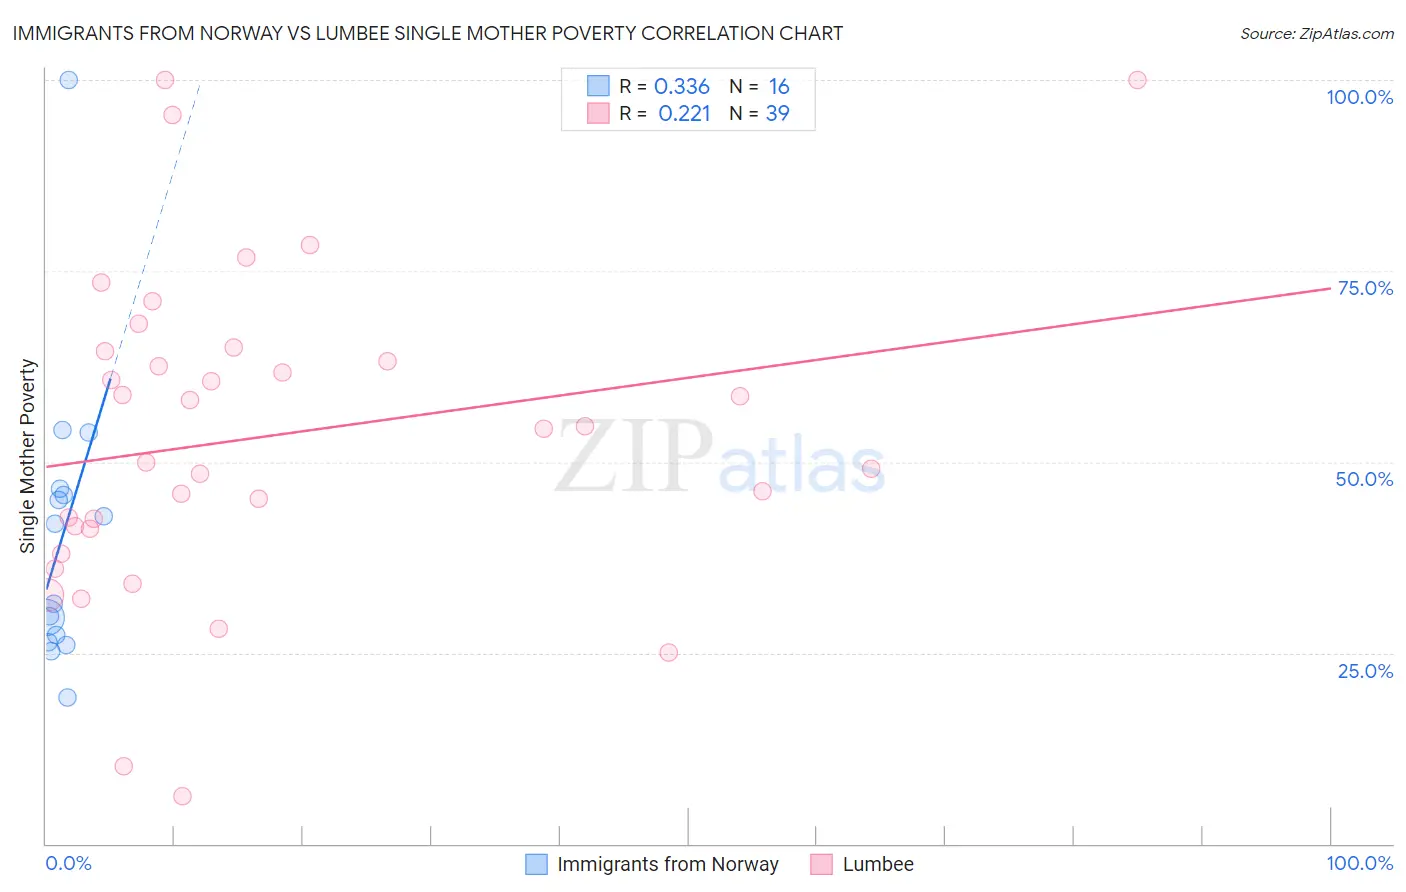
Immigrants from Norway vs Lumbee Single Mother Poverty Correlation Chart
The statistical analysis conducted on geographies consisting of 115,092,728 people shows a mild positive correlation between the proportion of Immigrants from Norway and poverty level among single mothers in the United States with a correlation coefficient (R) of 0.336 and weighted average of 29.3%. Similarly, the statistical analysis conducted on geographies consisting of 91,530,918 people shows a weak positive correlation between the proportion of Lumbee and poverty level among single mothers in the United States with a correlation coefficient (R) of 0.221 and weighted average of 43.2%, a difference of 47.7%.
Single Mother Poverty Correlation Summary
| Measurement | Immigrants from Norway | Lumbee |
| Minimum | 19.1% | 6.2% |
| Maximum | 100.0% | 100.0% |
| Range | 80.9% | 93.8% |
| Mean | 40.3% | 53.4% |
| Median | 36.6% | 54.4% |
| Interquartile 25% (IQ1) | 26.8% | 41.2% |
| Interquartile 75% (IQ3) | 46.1% | 64.5% |
| Interquartile Range (IQR) | 19.3% | 23.4% |
| Standard Deviation (Sample) | 19.3% | 21.1% |
| Standard Deviation (Population) | 18.7% | 20.9% |
Similar Demographics by Single Mother Poverty
Demographics Similar to Immigrants from Norway by Single Mother Poverty
In terms of single mother poverty, the demographic groups most similar to Immigrants from Norway are Immigrants from Uzbekistan (29.3%, a difference of 0.050%), Canadian (29.3%, a difference of 0.060%), South American Indian (29.3%, a difference of 0.090%), Immigrants from Eastern Africa (29.3%, a difference of 0.15%), and Nepalese (29.3%, a difference of 0.16%).
| Demographics | Rating | Rank | Single Mother Poverty |
| British | 50.6 /100 | #173 | Average 29.2% |
| Immigrants | Saudi Arabia | 50.0 /100 | #174 | Average 29.2% |
| Immigrants | Costa Rica | 48.8 /100 | #175 | Average 29.2% |
| Hawaiians | 47.8 /100 | #176 | Average 29.2% |
| Immigrants | Bosnia and Herzegovina | 45.1 /100 | #177 | Average 29.2% |
| South American Indians | 43.2 /100 | #178 | Average 29.3% |
| Immigrants | Uzbekistan | 42.6 /100 | #179 | Average 29.3% |
| Immigrants | Norway | 41.5 /100 | #180 | Average 29.3% |
| Canadians | 40.4 /100 | #181 | Average 29.3% |
| Immigrants | Eastern Africa | 38.5 /100 | #182 | Fair 29.3% |
| Nepalese | 38.3 /100 | #183 | Fair 29.3% |
| Nigerians | 38.0 /100 | #184 | Fair 29.3% |
| Ghanaians | 36.8 /100 | #185 | Fair 29.4% |
| Yugoslavians | 36.0 /100 | #186 | Fair 29.4% |
| Lebanese | 32.5 /100 | #187 | Fair 29.4% |
Demographics Similar to Lumbee by Single Mother Poverty
In terms of single mother poverty, the demographic groups most similar to Lumbee are Tohono O'odham (43.0%, a difference of 0.49%), Houma (43.5%, a difference of 0.62%), Puerto Rican (44.5%, a difference of 3.0%), Cajun (40.3%, a difference of 7.2%), and Navajo (40.2%, a difference of 7.5%).
| Demographics | Rating | Rank | Single Mother Poverty |
| Menominee | 0.0 /100 | #333 | Tragic 37.1% |
| Pueblo | 0.0 /100 | #334 | Tragic 37.2% |
| Yuman | 0.0 /100 | #335 | Tragic 37.8% |
| Cheyenne | 0.0 /100 | #336 | Tragic 38.5% |
| Immigrants | Yemen | 0.0 /100 | #337 | Tragic 38.5% |
| Pima | 0.0 /100 | #338 | Tragic 38.6% |
| Crow | 0.0 /100 | #339 | Tragic 38.6% |
| Sioux | 0.0 /100 | #340 | Tragic 38.8% |
| Colville | 0.0 /100 | #341 | Tragic 39.3% |
| Navajo | 0.0 /100 | #342 | Tragic 40.2% |
| Cajuns | 0.0 /100 | #343 | Tragic 40.3% |
| Tohono O'odham | 0.0 /100 | #344 | Tragic 43.0% |
| Lumbee | 0.0 /100 | #345 | Tragic 43.2% |
| Houma | 0.0 /100 | #346 | Tragic 43.5% |
| Puerto Ricans | 0.0 /100 | #347 | Tragic 44.5% |