Scotch-Irish vs Immigrants from Portugal Single Mother Poverty
COMPARE
Scotch-Irish
Immigrants from Portugal
Single Mother Poverty
Single Mother Poverty Comparison
Scotch-Irish
Immigrants from Portugal
31.5%
SINGLE MOTHER POVERTY
0.1/ 100
METRIC RATING
269th/ 347
METRIC RANK
30.5%
SINGLE MOTHER POVERTY
2.1/ 100
METRIC RATING
239th/ 347
METRIC RANK
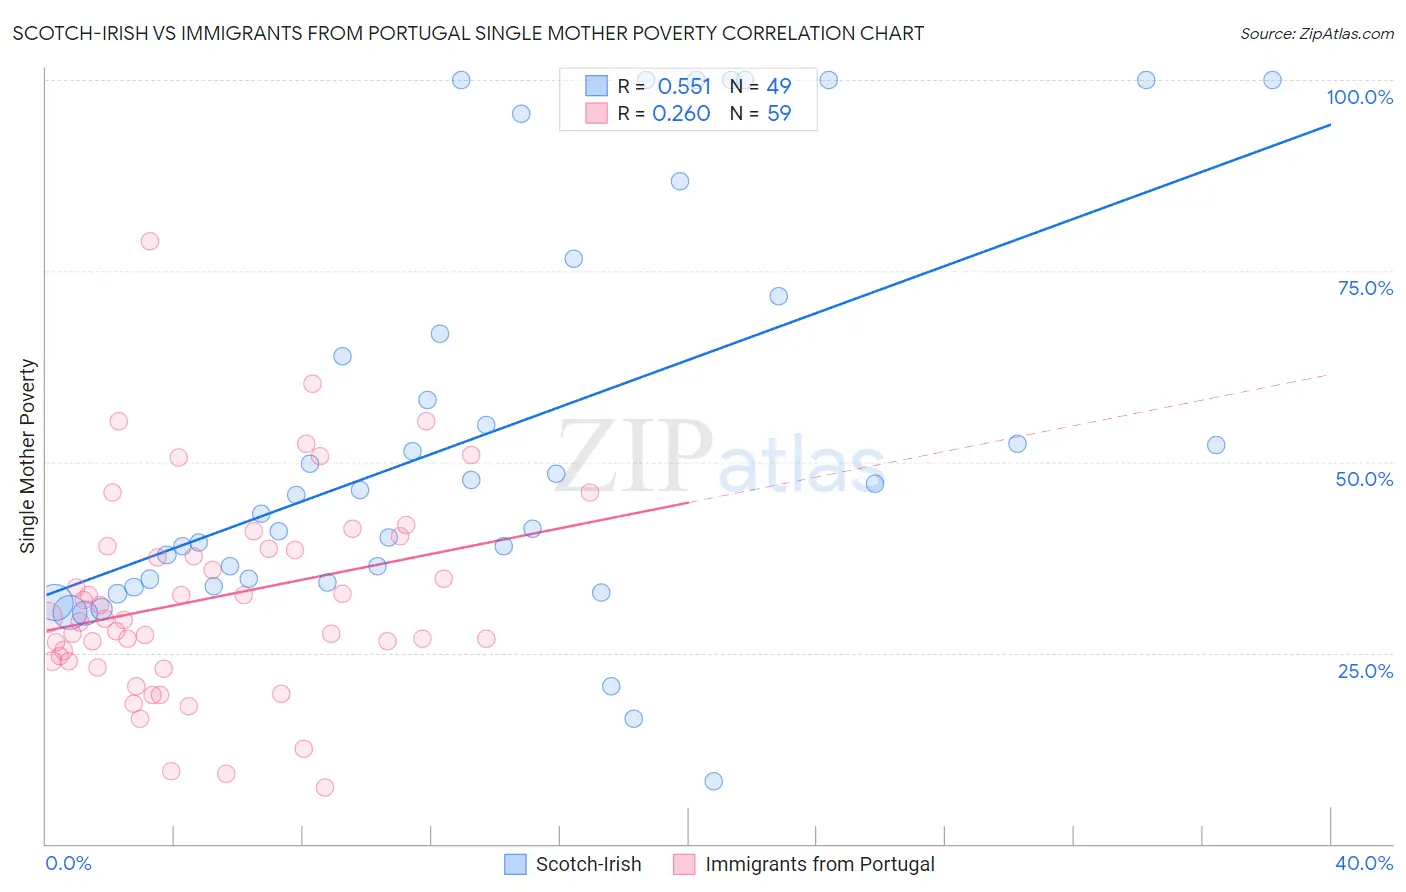
Scotch-Irish vs Immigrants from Portugal Single Mother Poverty Correlation Chart
The statistical analysis conducted on geographies consisting of 524,083,922 people shows a substantial positive correlation between the proportion of Scotch-Irish and poverty level among single mothers in the United States with a correlation coefficient (R) of 0.551 and weighted average of 31.5%. Similarly, the statistical analysis conducted on geographies consisting of 171,376,513 people shows a weak positive correlation between the proportion of Immigrants from Portugal and poverty level among single mothers in the United States with a correlation coefficient (R) of 0.260 and weighted average of 30.5%, a difference of 3.2%.
Single Mother Poverty Correlation Summary
| Measurement | Scotch-Irish | Immigrants from Portugal |
| Minimum | 8.1% | 7.4% |
| Maximum | 100.0% | 78.9% |
| Range | 91.9% | 71.6% |
| Mean | 53.3% | 32.2% |
| Median | 45.6% | 29.5% |
| Interquartile 25% (IQ1) | 34.5% | 23.9% |
| Interquartile 75% (IQ3) | 69.2% | 38.9% |
| Interquartile Range (IQR) | 34.7% | 15.0% |
| Standard Deviation (Sample) | 26.2% | 13.4% |
| Standard Deviation (Population) | 25.9% | 13.3% |
Similar Demographics by Single Mother Poverty
Demographics Similar to Scotch-Irish by Single Mother Poverty
In terms of single mother poverty, the demographic groups most similar to Scotch-Irish are Immigrants from Senegal (31.5%, a difference of 0.040%), British West Indian (31.5%, a difference of 0.050%), Immigrants from Belize (31.4%, a difference of 0.22%), Immigrants from Cabo Verde (31.6%, a difference of 0.29%), and Immigrants from Micronesia (31.6%, a difference of 0.30%).
| Demographics | Rating | Rank | Single Mother Poverty |
| Hmong | 0.3 /100 | #262 | Tragic 31.2% |
| Bahamians | 0.2 /100 | #263 | Tragic 31.3% |
| Immigrants | Ecuador | 0.2 /100 | #264 | Tragic 31.3% |
| German Russians | 0.2 /100 | #265 | Tragic 31.3% |
| Sub-Saharan Africans | 0.2 /100 | #266 | Tragic 31.4% |
| Immigrants | Belize | 0.2 /100 | #267 | Tragic 31.4% |
| Immigrants | Senegal | 0.1 /100 | #268 | Tragic 31.5% |
| Scotch-Irish | 0.1 /100 | #269 | Tragic 31.5% |
| British West Indians | 0.1 /100 | #270 | Tragic 31.5% |
| Immigrants | Cabo Verde | 0.1 /100 | #271 | Tragic 31.6% |
| Immigrants | Micronesia | 0.1 /100 | #272 | Tragic 31.6% |
| Fijians | 0.1 /100 | #273 | Tragic 31.6% |
| Bangladeshis | 0.1 /100 | #274 | Tragic 31.7% |
| Central Americans | 0.1 /100 | #275 | Tragic 31.8% |
| Delaware | 0.0 /100 | #276 | Tragic 31.8% |
Demographics Similar to Immigrants from Portugal by Single Mother Poverty
In terms of single mother poverty, the demographic groups most similar to Immigrants from Portugal are Salvadoran (30.6%, a difference of 0.13%), Immigrants from Laos (30.6%, a difference of 0.18%), Immigrants from Burma/Myanmar (30.6%, a difference of 0.20%), Bermudan (30.6%, a difference of 0.28%), and Slovak (30.4%, a difference of 0.36%).
| Demographics | Rating | Rank | Single Mother Poverty |
| Alaskan Athabascans | 4.1 /100 | #232 | Tragic 30.3% |
| Immigrants | Middle Africa | 3.5 /100 | #233 | Tragic 30.3% |
| Immigrants | Nicaragua | 3.5 /100 | #234 | Tragic 30.3% |
| Immigrants | Grenada | 3.4 /100 | #235 | Tragic 30.3% |
| Welsh | 3.2 /100 | #236 | Tragic 30.4% |
| Immigrants | St. Vincent and the Grenadines | 3.1 /100 | #237 | Tragic 30.4% |
| Slovaks | 2.8 /100 | #238 | Tragic 30.4% |
| Immigrants | Portugal | 2.1 /100 | #239 | Tragic 30.5% |
| Salvadorans | 1.8 /100 | #240 | Tragic 30.6% |
| Immigrants | Laos | 1.8 /100 | #241 | Tragic 30.6% |
| Immigrants | Burma/Myanmar | 1.7 /100 | #242 | Tragic 30.6% |
| Bermudans | 1.6 /100 | #243 | Tragic 30.6% |
| French | 1.3 /100 | #244 | Tragic 30.7% |
| Barbadians | 1.3 /100 | #245 | Tragic 30.7% |
| Ecuadorians | 0.9 /100 | #246 | Tragic 30.8% |