Scotch-Irish vs Pima Single Father Poverty
COMPARE
Scotch-Irish
Pima
Single Father Poverty
Single Father Poverty Comparison
Scotch-Irish
Pima
18.6%
SINGLE FATHER POVERTY
0.0/ 100
METRIC RATING
306th/ 347
METRIC RANK
14.8%
SINGLE FATHER POVERTY
100.0/ 100
METRIC RATING
40th/ 347
METRIC RANK
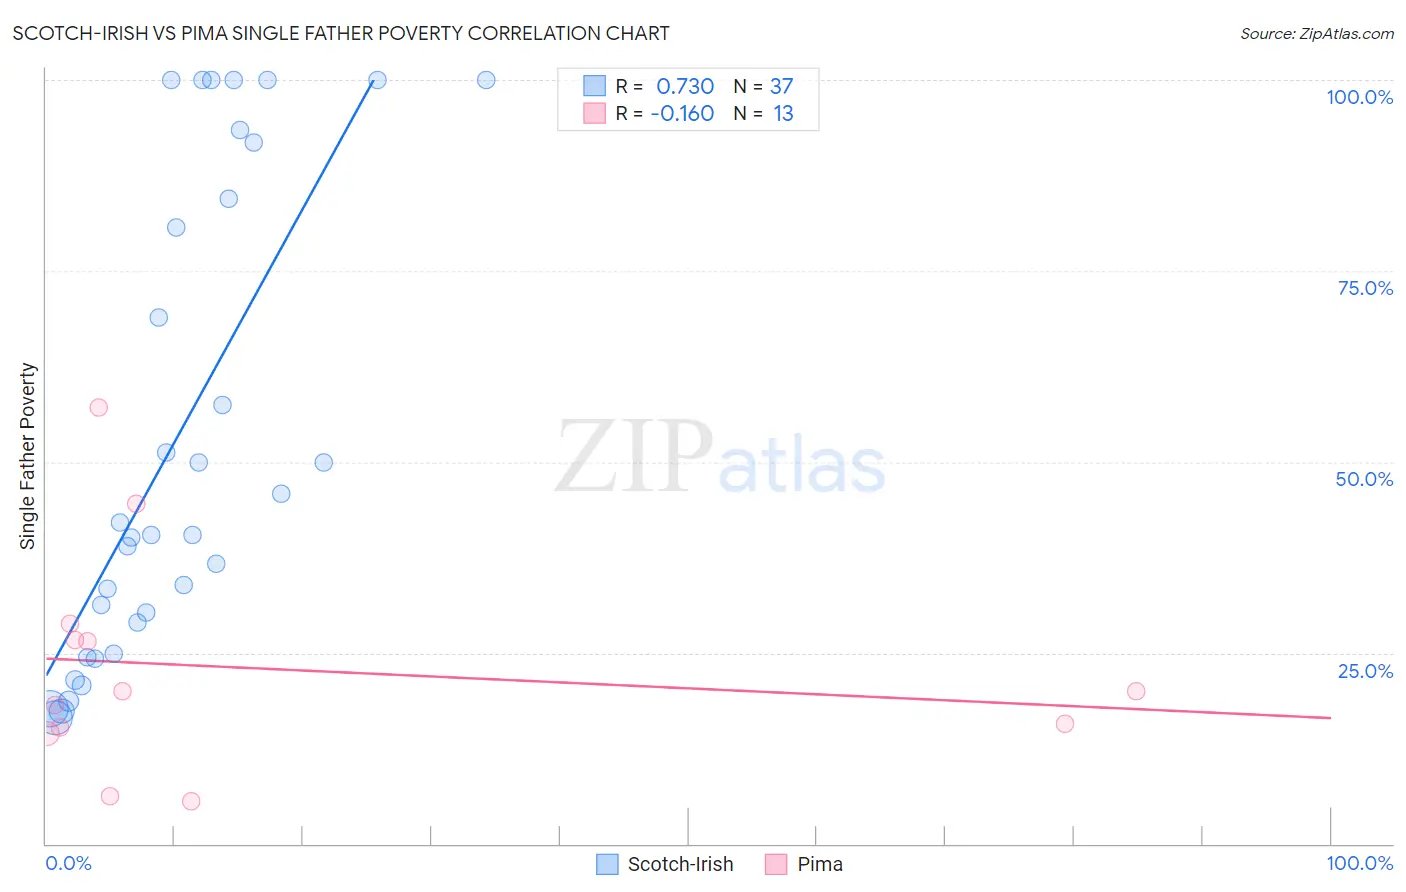
Scotch-Irish vs Pima Single Father Poverty Correlation Chart
The statistical analysis conducted on geographies consisting of 395,393,443 people shows a strong positive correlation between the proportion of Scotch-Irish and poverty level among single fathers in the United States with a correlation coefficient (R) of 0.730 and weighted average of 18.6%. Similarly, the statistical analysis conducted on geographies consisting of 58,926,282 people shows a poor negative correlation between the proportion of Pima and poverty level among single fathers in the United States with a correlation coefficient (R) of -0.160 and weighted average of 14.8%, a difference of 25.7%.
Single Father Poverty Correlation Summary
| Measurement | Scotch-Irish | Pima |
| Minimum | 16.5% | 5.6% |
| Maximum | 100.0% | 57.1% |
| Range | 83.5% | 51.6% |
| Mean | 52.9% | 23.0% |
| Median | 40.5% | 20.0% |
| Interquartile 25% (IQ1) | 27.0% | 14.9% |
| Interquartile 75% (IQ3) | 88.2% | 27.7% |
| Interquartile Range (IQR) | 61.2% | 12.9% |
| Standard Deviation (Sample) | 30.5% | 14.4% |
| Standard Deviation (Population) | 30.1% | 13.9% |
Similar Demographics by Single Father Poverty
Demographics Similar to Scotch-Irish by Single Father Poverty
In terms of single father poverty, the demographic groups most similar to Scotch-Irish are French Canadian (18.6%, a difference of 0.040%), Ottawa (18.6%, a difference of 0.060%), Immigrants from Micronesia (18.6%, a difference of 0.17%), Blackfeet (18.5%, a difference of 0.22%), and Ute (18.5%, a difference of 0.27%).
| Demographics | Rating | Rank | Single Father Poverty |
| Whites/Caucasians | 0.0 /100 | #299 | Tragic 18.4% |
| Immigrants | Dominican Republic | 0.0 /100 | #300 | Tragic 18.4% |
| Hungarians | 0.0 /100 | #301 | Tragic 18.5% |
| Comanche | 0.0 /100 | #302 | Tragic 18.5% |
| Celtics | 0.0 /100 | #303 | Tragic 18.5% |
| Ute | 0.0 /100 | #304 | Tragic 18.5% |
| Blackfeet | 0.0 /100 | #305 | Tragic 18.5% |
| Scotch-Irish | 0.0 /100 | #306 | Tragic 18.6% |
| French Canadians | 0.0 /100 | #307 | Tragic 18.6% |
| Ottawa | 0.0 /100 | #308 | Tragic 18.6% |
| Immigrants | Micronesia | 0.0 /100 | #309 | Tragic 18.6% |
| Chippewa | 0.0 /100 | #310 | Tragic 18.8% |
| Immigrants | Nonimmigrants | 0.0 /100 | #311 | Tragic 18.8% |
| Immigrants | Dominica | 0.0 /100 | #312 | Tragic 18.9% |
| Potawatomi | 0.0 /100 | #313 | Tragic 18.9% |
Demographics Similar to Pima by Single Father Poverty
In terms of single father poverty, the demographic groups most similar to Pima are Indian (Asian) (14.8%, a difference of 0.17%), Immigrants from Nepal (14.8%, a difference of 0.17%), Immigrants from Asia (14.7%, a difference of 0.20%), Immigrants from Eritrea (14.8%, a difference of 0.21%), and Bolivian (14.7%, a difference of 0.37%).
| Demographics | Rating | Rank | Single Father Poverty |
| Okinawans | 100.0 /100 | #33 | Exceptional 14.6% |
| Egyptians | 100.0 /100 | #34 | Exceptional 14.7% |
| Immigrants | Bolivia | 100.0 /100 | #35 | Exceptional 14.7% |
| Immigrants | Indonesia | 100.0 /100 | #36 | Exceptional 14.7% |
| Immigrants | Eastern Africa | 100.0 /100 | #37 | Exceptional 14.7% |
| Bolivians | 100.0 /100 | #38 | Exceptional 14.7% |
| Immigrants | Asia | 100.0 /100 | #39 | Exceptional 14.7% |
| Pima | 100.0 /100 | #40 | Exceptional 14.8% |
| Indians (Asian) | 100.0 /100 | #41 | Exceptional 14.8% |
| Immigrants | Nepal | 100.0 /100 | #42 | Exceptional 14.8% |
| Immigrants | Eritrea | 100.0 /100 | #43 | Exceptional 14.8% |
| Salvadorans | 100.0 /100 | #44 | Exceptional 14.9% |
| Immigrants | Somalia | 100.0 /100 | #45 | Exceptional 14.9% |
| Immigrants | Cambodia | 99.9 /100 | #46 | Exceptional 14.9% |
| Immigrants | China | 99.9 /100 | #47 | Exceptional 14.9% |