Scotch-Irish vs Immigrants from Bulgaria Single Father Poverty
COMPARE
Scotch-Irish
Immigrants from Bulgaria
Single Father Poverty
Single Father Poverty Comparison
Scotch-Irish
Immigrants from Bulgaria
18.6%
SINGLE FATHER POVERTY
0.0/ 100
METRIC RATING
306th/ 347
METRIC RANK
15.0%
SINGLE FATHER POVERTY
99.9/ 100
METRIC RATING
55th/ 347
METRIC RANK
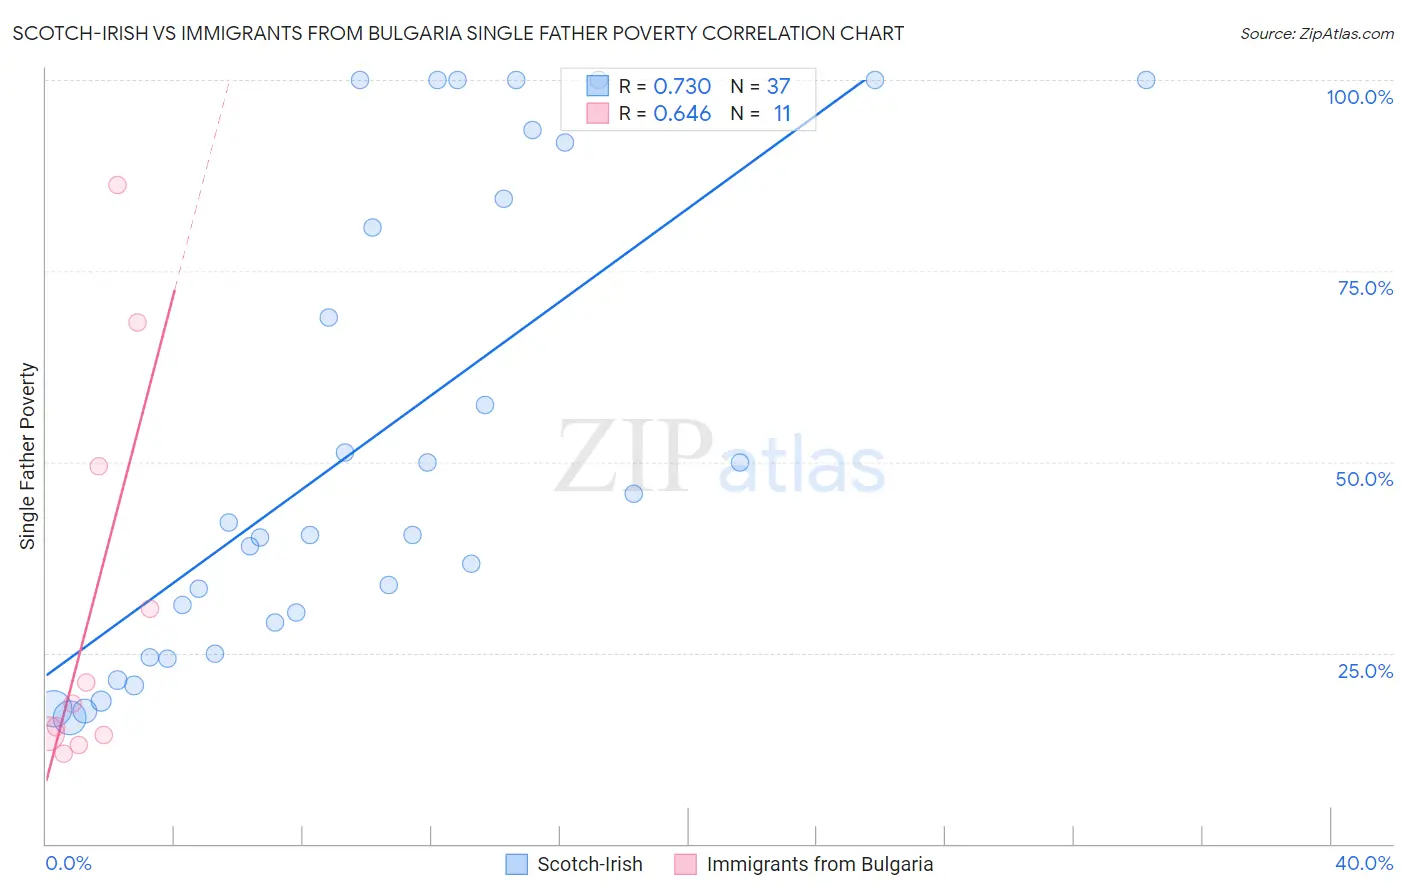
Scotch-Irish vs Immigrants from Bulgaria Single Father Poverty Correlation Chart
The statistical analysis conducted on geographies consisting of 395,393,443 people shows a strong positive correlation between the proportion of Scotch-Irish and poverty level among single fathers in the United States with a correlation coefficient (R) of 0.730 and weighted average of 18.6%. Similarly, the statistical analysis conducted on geographies consisting of 145,942,181 people shows a significant positive correlation between the proportion of Immigrants from Bulgaria and poverty level among single fathers in the United States with a correlation coefficient (R) of 0.646 and weighted average of 15.0%, a difference of 23.6%.
Single Father Poverty Correlation Summary
| Measurement | Scotch-Irish | Immigrants from Bulgaria |
| Minimum | 16.5% | 11.8% |
| Maximum | 100.0% | 86.2% |
| Range | 83.5% | 74.4% |
| Mean | 52.9% | 31.2% |
| Median | 40.5% | 18.3% |
| Interquartile 25% (IQ1) | 27.0% | 14.3% |
| Interquartile 75% (IQ3) | 88.2% | 49.4% |
| Interquartile Range (IQR) | 61.2% | 35.1% |
| Standard Deviation (Sample) | 30.5% | 25.5% |
| Standard Deviation (Population) | 30.1% | 24.4% |
Similar Demographics by Single Father Poverty
Demographics Similar to Scotch-Irish by Single Father Poverty
In terms of single father poverty, the demographic groups most similar to Scotch-Irish are French Canadian (18.6%, a difference of 0.040%), Ottawa (18.6%, a difference of 0.060%), Immigrants from Micronesia (18.6%, a difference of 0.17%), Blackfeet (18.5%, a difference of 0.22%), and Ute (18.5%, a difference of 0.27%).
| Demographics | Rating | Rank | Single Father Poverty |
| Whites/Caucasians | 0.0 /100 | #299 | Tragic 18.4% |
| Immigrants | Dominican Republic | 0.0 /100 | #300 | Tragic 18.4% |
| Hungarians | 0.0 /100 | #301 | Tragic 18.5% |
| Comanche | 0.0 /100 | #302 | Tragic 18.5% |
| Celtics | 0.0 /100 | #303 | Tragic 18.5% |
| Ute | 0.0 /100 | #304 | Tragic 18.5% |
| Blackfeet | 0.0 /100 | #305 | Tragic 18.5% |
| Scotch-Irish | 0.0 /100 | #306 | Tragic 18.6% |
| French Canadians | 0.0 /100 | #307 | Tragic 18.6% |
| Ottawa | 0.0 /100 | #308 | Tragic 18.6% |
| Immigrants | Micronesia | 0.0 /100 | #309 | Tragic 18.6% |
| Chippewa | 0.0 /100 | #310 | Tragic 18.8% |
| Immigrants | Nonimmigrants | 0.0 /100 | #311 | Tragic 18.8% |
| Immigrants | Dominica | 0.0 /100 | #312 | Tragic 18.9% |
| Potawatomi | 0.0 /100 | #313 | Tragic 18.9% |
Demographics Similar to Immigrants from Bulgaria by Single Father Poverty
In terms of single father poverty, the demographic groups most similar to Immigrants from Bulgaria are Immigrants from Uzbekistan (15.0%, a difference of 0.050%), Immigrants from Kenya (15.0%, a difference of 0.23%), Immigrants from El Salvador (15.0%, a difference of 0.26%), Immigrants from Laos (15.1%, a difference of 0.28%), and Immigrants from Pakistan (15.0%, a difference of 0.30%).
| Demographics | Rating | Rank | Single Father Poverty |
| Malaysians | 99.9 /100 | #48 | Exceptional 14.9% |
| Immigrants | Eastern Asia | 99.9 /100 | #49 | Exceptional 15.0% |
| Bhutanese | 99.9 /100 | #50 | Exceptional 15.0% |
| Immigrants | Pakistan | 99.9 /100 | #51 | Exceptional 15.0% |
| Immigrants | El Salvador | 99.9 /100 | #52 | Exceptional 15.0% |
| Immigrants | Kenya | 99.9 /100 | #53 | Exceptional 15.0% |
| Immigrants | Uzbekistan | 99.9 /100 | #54 | Exceptional 15.0% |
| Immigrants | Bulgaria | 99.9 /100 | #55 | Exceptional 15.0% |
| Immigrants | Laos | 99.9 /100 | #56 | Exceptional 15.1% |
| Laotians | 99.9 /100 | #57 | Exceptional 15.1% |
| Hawaiians | 99.9 /100 | #58 | Exceptional 15.1% |
| Guamanians/Chamorros | 99.9 /100 | #59 | Exceptional 15.1% |
| Puget Sound Salish | 99.8 /100 | #60 | Exceptional 15.2% |
| Immigrants | Bosnia and Herzegovina | 99.8 /100 | #61 | Exceptional 15.2% |
| Immigrants | Armenia | 99.8 /100 | #62 | Exceptional 15.2% |