Honduran vs Chinese Single Father Poverty
COMPARE
Honduran
Chinese
Single Father Poverty
Single Father Poverty Comparison
Hondurans
Chinese
17.0%
SINGLE FATHER POVERTY
1.6/ 100
METRIC RATING
244th/ 347
METRIC RANK
15.4%
SINGLE FATHER POVERTY
99.3/ 100
METRIC RATING
83rd/ 347
METRIC RANK
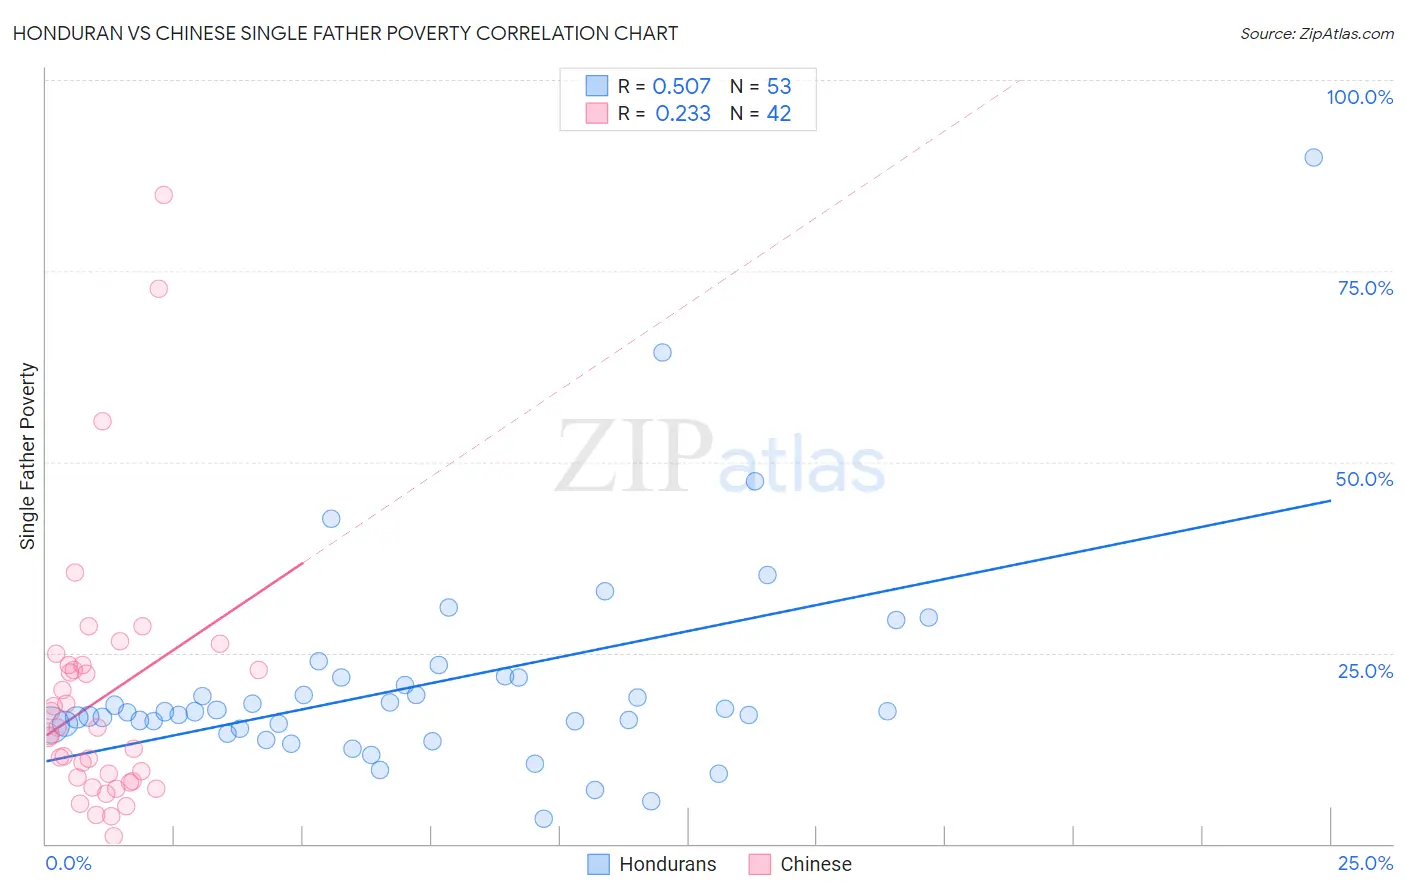
Honduran vs Chinese Single Father Poverty Correlation Chart
The statistical analysis conducted on geographies consisting of 295,716,434 people shows a substantial positive correlation between the proportion of Hondurans and poverty level among single fathers in the United States with a correlation coefficient (R) of 0.507 and weighted average of 17.0%. Similarly, the statistical analysis conducted on geographies consisting of 60,120,579 people shows a weak positive correlation between the proportion of Chinese and poverty level among single fathers in the United States with a correlation coefficient (R) of 0.233 and weighted average of 15.4%, a difference of 10.6%.
Single Father Poverty Correlation Summary
| Measurement | Honduran | Chinese |
| Minimum | 3.3% | 0.92% |
| Maximum | 89.9% | 85.0% |
| Range | 86.6% | 84.1% |
| Mean | 20.9% | 19.0% |
| Median | 17.3% | 14.7% |
| Interquartile 25% (IQ1) | 15.3% | 8.1% |
| Interquartile 75% (IQ3) | 21.8% | 23.5% |
| Interquartile Range (IQR) | 6.5% | 15.4% |
| Standard Deviation (Sample) | 14.1% | 17.0% |
| Standard Deviation (Population) | 14.0% | 16.8% |
Similar Demographics by Single Father Poverty
Demographics Similar to Hondurans by Single Father Poverty
In terms of single father poverty, the demographic groups most similar to Hondurans are Immigrants from Cabo Verde (17.0%, a difference of 0.020%), Trinidadian and Tobagonian (17.0%, a difference of 0.040%), Immigrants from Ireland (17.1%, a difference of 0.080%), Greek (17.1%, a difference of 0.18%), and Czechoslovakian (17.1%, a difference of 0.18%).
| Demographics | Rating | Rank | Single Father Poverty |
| Sub-Saharan Africans | 2.9 /100 | #237 | Tragic 16.9% |
| Immigrants | Saudi Arabia | 2.7 /100 | #238 | Tragic 16.9% |
| Bermudans | 2.6 /100 | #239 | Tragic 16.9% |
| Finns | 2.6 /100 | #240 | Tragic 16.9% |
| Czechs | 2.3 /100 | #241 | Tragic 17.0% |
| Moroccans | 2.1 /100 | #242 | Tragic 17.0% |
| Immigrants | Cabo Verde | 1.6 /100 | #243 | Tragic 17.0% |
| Hondurans | 1.6 /100 | #244 | Tragic 17.0% |
| Trinidadians and Tobagonians | 1.5 /100 | #245 | Tragic 17.0% |
| Immigrants | Ireland | 1.4 /100 | #246 | Tragic 17.1% |
| Greeks | 1.3 /100 | #247 | Tragic 17.1% |
| Czechoslovakians | 1.3 /100 | #248 | Tragic 17.1% |
| Canadians | 1.3 /100 | #249 | Tragic 17.1% |
| Austrians | 1.1 /100 | #250 | Tragic 17.1% |
| Luxembourgers | 1.1 /100 | #251 | Tragic 17.1% |
Demographics Similar to Chinese by Single Father Poverty
In terms of single father poverty, the demographic groups most similar to Chinese are Immigrants from Ukraine (15.4%, a difference of 0.090%), Immigrants from Congo (15.4%, a difference of 0.10%), Armenian (15.4%, a difference of 0.12%), Peruvian (15.4%, a difference of 0.14%), and Immigrants from Oceania (15.4%, a difference of 0.25%).
| Demographics | Rating | Rank | Single Father Poverty |
| Immigrants | Japan | 99.5 /100 | #76 | Exceptional 15.3% |
| Immigrants | Peru | 99.5 /100 | #77 | Exceptional 15.3% |
| Tlingit-Haida | 99.5 /100 | #78 | Exceptional 15.3% |
| Immigrants | Northern Africa | 99.5 /100 | #79 | Exceptional 15.3% |
| Armenians | 99.4 /100 | #80 | Exceptional 15.4% |
| Immigrants | Congo | 99.4 /100 | #81 | Exceptional 15.4% |
| Immigrants | Ukraine | 99.4 /100 | #82 | Exceptional 15.4% |
| Chinese | 99.3 /100 | #83 | Exceptional 15.4% |
| Peruvians | 99.2 /100 | #84 | Exceptional 15.4% |
| Immigrants | Oceania | 99.1 /100 | #85 | Exceptional 15.4% |
| Immigrants | Russia | 99.0 /100 | #86 | Exceptional 15.5% |
| Brazilians | 99.0 /100 | #87 | Exceptional 15.5% |
| Burmese | 99.0 /100 | #88 | Exceptional 15.5% |
| Immigrants | Korea | 99.0 /100 | #89 | Exceptional 15.5% |
| Mexican American Indians | 98.7 /100 | #90 | Exceptional 15.5% |