Scotch-Irish vs Immigrants from Ecuador Single Father Poverty
COMPARE
Scotch-Irish
Immigrants from Ecuador
Single Father Poverty
Single Father Poverty Comparison
Scotch-Irish
Immigrants from Ecuador
18.6%
SINGLE FATHER POVERTY
0.0/ 100
METRIC RATING
306th/ 347
METRIC RANK
16.3%
SINGLE FATHER POVERTY
49.7/ 100
METRIC RATING
175th/ 347
METRIC RANK
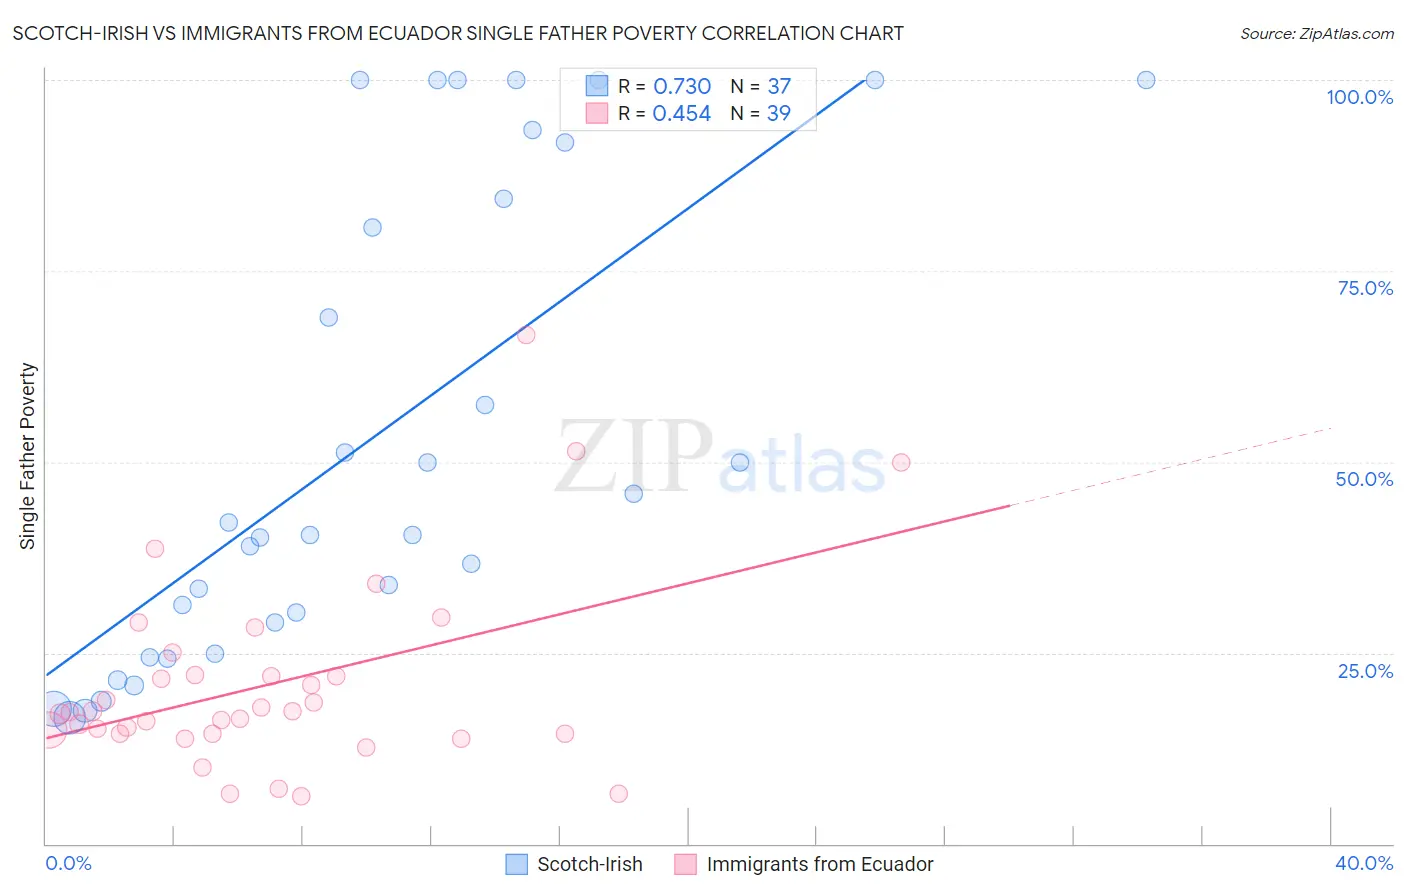
Scotch-Irish vs Immigrants from Ecuador Single Father Poverty Correlation Chart
The statistical analysis conducted on geographies consisting of 395,393,443 people shows a strong positive correlation between the proportion of Scotch-Irish and poverty level among single fathers in the United States with a correlation coefficient (R) of 0.730 and weighted average of 18.6%. Similarly, the statistical analysis conducted on geographies consisting of 223,687,874 people shows a moderate positive correlation between the proportion of Immigrants from Ecuador and poverty level among single fathers in the United States with a correlation coefficient (R) of 0.454 and weighted average of 16.3%, a difference of 13.9%.
Single Father Poverty Correlation Summary
| Measurement | Scotch-Irish | Immigrants from Ecuador |
| Minimum | 16.5% | 6.2% |
| Maximum | 100.0% | 66.7% |
| Range | 83.5% | 60.5% |
| Mean | 52.9% | 20.9% |
| Median | 40.5% | 17.3% |
| Interquartile 25% (IQ1) | 27.0% | 14.3% |
| Interquartile 75% (IQ3) | 88.2% | 22.0% |
| Interquartile Range (IQR) | 61.2% | 7.7% |
| Standard Deviation (Sample) | 30.5% | 12.7% |
| Standard Deviation (Population) | 30.1% | 12.5% |
Similar Demographics by Single Father Poverty
Demographics Similar to Scotch-Irish by Single Father Poverty
In terms of single father poverty, the demographic groups most similar to Scotch-Irish are French Canadian (18.6%, a difference of 0.040%), Ottawa (18.6%, a difference of 0.060%), Immigrants from Micronesia (18.6%, a difference of 0.17%), Blackfeet (18.5%, a difference of 0.22%), and Ute (18.5%, a difference of 0.27%).
| Demographics | Rating | Rank | Single Father Poverty |
| Whites/Caucasians | 0.0 /100 | #299 | Tragic 18.4% |
| Immigrants | Dominican Republic | 0.0 /100 | #300 | Tragic 18.4% |
| Hungarians | 0.0 /100 | #301 | Tragic 18.5% |
| Comanche | 0.0 /100 | #302 | Tragic 18.5% |
| Celtics | 0.0 /100 | #303 | Tragic 18.5% |
| Ute | 0.0 /100 | #304 | Tragic 18.5% |
| Blackfeet | 0.0 /100 | #305 | Tragic 18.5% |
| Scotch-Irish | 0.0 /100 | #306 | Tragic 18.6% |
| French Canadians | 0.0 /100 | #307 | Tragic 18.6% |
| Ottawa | 0.0 /100 | #308 | Tragic 18.6% |
| Immigrants | Micronesia | 0.0 /100 | #309 | Tragic 18.6% |
| Chippewa | 0.0 /100 | #310 | Tragic 18.8% |
| Immigrants | Nonimmigrants | 0.0 /100 | #311 | Tragic 18.8% |
| Immigrants | Dominica | 0.0 /100 | #312 | Tragic 18.9% |
| Potawatomi | 0.0 /100 | #313 | Tragic 18.9% |
Demographics Similar to Immigrants from Ecuador by Single Father Poverty
In terms of single father poverty, the demographic groups most similar to Immigrants from Ecuador are Immigrants from Sierra Leone (16.3%, a difference of 0.020%), Immigrants from St. Vincent and the Grenadines (16.3%, a difference of 0.020%), Swedish (16.3%, a difference of 0.020%), Immigrants from Morocco (16.3%, a difference of 0.050%), and Vietnamese (16.3%, a difference of 0.070%).
| Demographics | Rating | Rank | Single Father Poverty |
| Costa Ricans | 53.6 /100 | #168 | Average 16.3% |
| Northern Europeans | 52.8 /100 | #169 | Average 16.3% |
| Scandinavians | 52.3 /100 | #170 | Average 16.3% |
| Immigrants | Morocco | 50.7 /100 | #171 | Average 16.3% |
| Immigrants | Sierra Leone | 50.1 /100 | #172 | Average 16.3% |
| Immigrants | St. Vincent and the Grenadines | 50.0 /100 | #173 | Average 16.3% |
| Swedes | 50.0 /100 | #174 | Average 16.3% |
| Immigrants | Ecuador | 49.7 /100 | #175 | Average 16.3% |
| Vietnamese | 48.0 /100 | #176 | Average 16.3% |
| Immigrants | South Africa | 44.2 /100 | #177 | Average 16.3% |
| Immigrants | Cuba | 41.6 /100 | #178 | Average 16.4% |
| Serbians | 40.9 /100 | #179 | Average 16.4% |
| Immigrants | Latin America | 37.2 /100 | #180 | Fair 16.4% |
| Immigrants | Western Africa | 36.0 /100 | #181 | Fair 16.4% |
| Immigrants | Italy | 35.7 /100 | #182 | Fair 16.4% |