Slovak vs Trinidadian and Tobagonian Female Poverty
COMPARE
Slovak
Trinidadian and Tobagonian
Female Poverty
Female Poverty Comparison
Slovaks
Trinidadians and Tobagonians
12.3%
FEMALE POVERTY
97.1/ 100
METRIC RATING
80th/ 347
METRIC RANK
15.4%
FEMALE POVERTY
0.2/ 100
METRIC RATING
254th/ 347
METRIC RANK
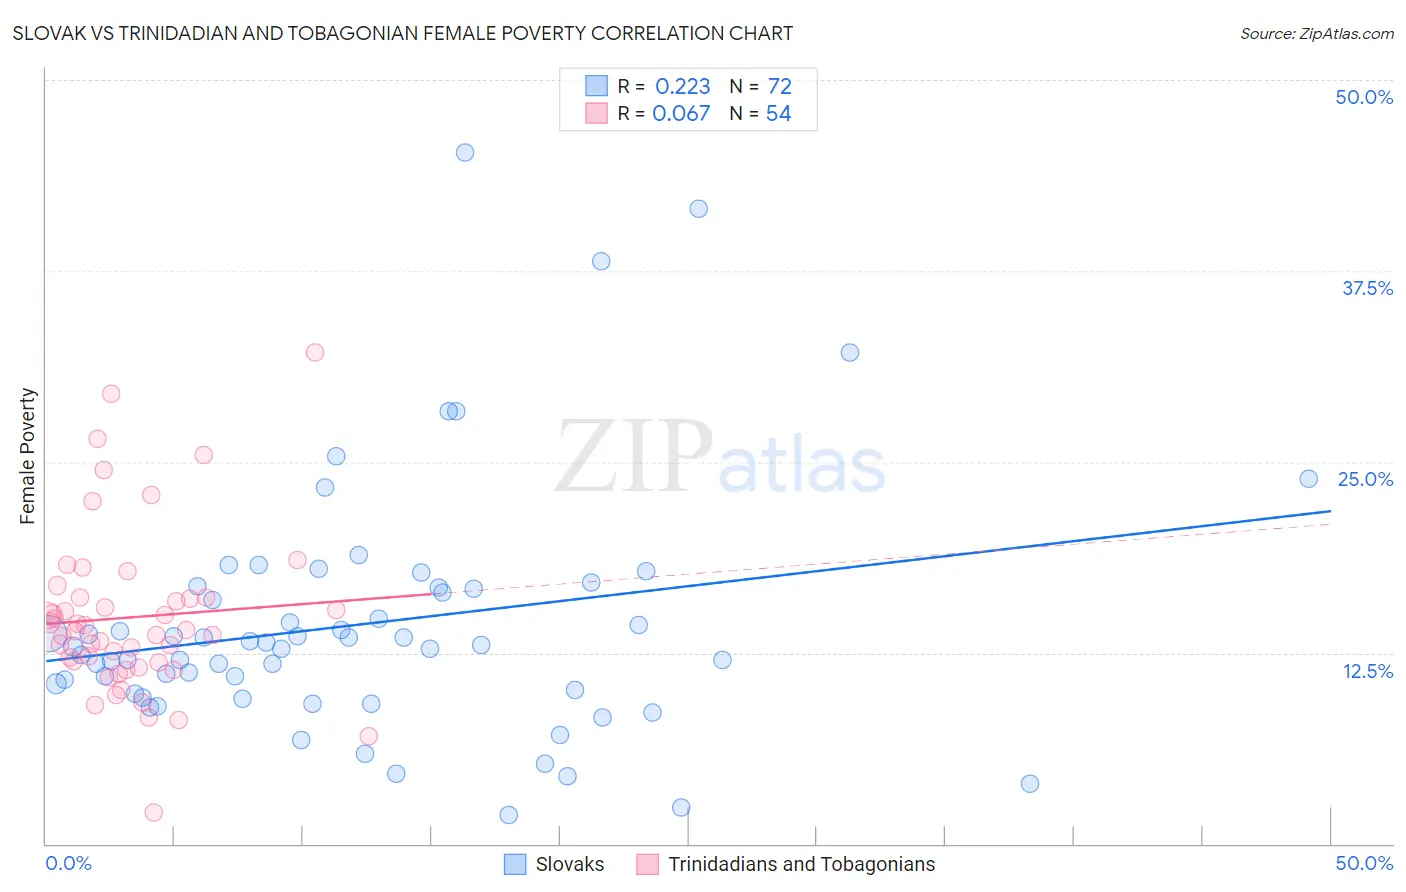
Slovak vs Trinidadian and Tobagonian Female Poverty Correlation Chart
The statistical analysis conducted on geographies consisting of 397,576,830 people shows a weak positive correlation between the proportion of Slovaks and poverty level among females in the United States with a correlation coefficient (R) of 0.223 and weighted average of 12.3%. Similarly, the statistical analysis conducted on geographies consisting of 219,692,358 people shows a slight positive correlation between the proportion of Trinidadians and Tobagonians and poverty level among females in the United States with a correlation coefficient (R) of 0.067 and weighted average of 15.4%, a difference of 25.4%.
Female Poverty Correlation Summary
| Measurement | Slovak | Trinidadian and Tobagonian |
| Minimum | 1.9% | 2.0% |
| Maximum | 45.3% | 32.1% |
| Range | 43.4% | 30.1% |
| Mean | 14.4% | 14.8% |
| Median | 12.9% | 13.9% |
| Interquartile 25% (IQ1) | 9.9% | 11.9% |
| Interquartile 75% (IQ3) | 16.7% | 16.1% |
| Interquartile Range (IQR) | 6.8% | 4.2% |
| Standard Deviation (Sample) | 8.1% | 5.5% |
| Standard Deviation (Population) | 8.0% | 5.4% |
Similar Demographics by Female Poverty
Demographics Similar to Slovaks by Female Poverty
In terms of female poverty, the demographic groups most similar to Slovaks are Immigrants from Sweden (12.3%, a difference of 0.0%), Jordanian (12.3%, a difference of 0.010%), Immigrants from North America (12.3%, a difference of 0.050%), Egyptian (12.3%, a difference of 0.12%), and Serbian (12.3%, a difference of 0.13%).
| Demographics | Rating | Rank | Female Poverty |
| Zimbabweans | 97.5 /100 | #73 | Exceptional 12.3% |
| Immigrants | Canada | 97.5 /100 | #74 | Exceptional 12.3% |
| Europeans | 97.4 /100 | #75 | Exceptional 12.3% |
| Immigrants | Eastern Europe | 97.2 /100 | #76 | Exceptional 12.3% |
| Serbians | 97.2 /100 | #77 | Exceptional 12.3% |
| Egyptians | 97.2 /100 | #78 | Exceptional 12.3% |
| Immigrants | North America | 97.1 /100 | #79 | Exceptional 12.3% |
| Slovaks | 97.1 /100 | #80 | Exceptional 12.3% |
| Immigrants | Sweden | 97.1 /100 | #81 | Exceptional 12.3% |
| Jordanians | 97.1 /100 | #82 | Exceptional 12.3% |
| Immigrants | England | 96.9 /100 | #83 | Exceptional 12.3% |
| Northern Europeans | 96.6 /100 | #84 | Exceptional 12.4% |
| Irish | 96.5 /100 | #85 | Exceptional 12.4% |
| Dutch | 96.5 /100 | #86 | Exceptional 12.4% |
| Okinawans | 96.4 /100 | #87 | Exceptional 12.4% |
Demographics Similar to Trinidadians and Tobagonians by Female Poverty
In terms of female poverty, the demographic groups most similar to Trinidadians and Tobagonians are Liberian (15.4%, a difference of 0.24%), Ottawa (15.5%, a difference of 0.31%), Immigrants from Burma/Myanmar (15.4%, a difference of 0.50%), Immigrants from Trinidad and Tobago (15.4%, a difference of 0.53%), and Jamaican (15.5%, a difference of 0.61%).
| Demographics | Rating | Rank | Female Poverty |
| Potawatomi | 0.3 /100 | #247 | Tragic 15.3% |
| Immigrants | Ghana | 0.3 /100 | #248 | Tragic 15.3% |
| Salvadorans | 0.3 /100 | #249 | Tragic 15.3% |
| Immigrants | Western Africa | 0.3 /100 | #250 | Tragic 15.3% |
| Immigrants | Trinidad and Tobago | 0.3 /100 | #251 | Tragic 15.4% |
| Immigrants | Burma/Myanmar | 0.3 /100 | #252 | Tragic 15.4% |
| Liberians | 0.2 /100 | #253 | Tragic 15.4% |
| Trinidadians and Tobagonians | 0.2 /100 | #254 | Tragic 15.4% |
| Ottawa | 0.2 /100 | #255 | Tragic 15.5% |
| Jamaicans | 0.2 /100 | #256 | Tragic 15.5% |
| Immigrants | Jamaica | 0.1 /100 | #257 | Tragic 15.6% |
| Shoshone | 0.1 /100 | #258 | Tragic 15.6% |
| Cape Verdeans | 0.1 /100 | #259 | Tragic 15.6% |
| Immigrants | Guyana | 0.1 /100 | #260 | Tragic 15.6% |
| Guyanese | 0.1 /100 | #261 | Tragic 15.6% |