Menominee vs Trinidadian and Tobagonian Female Poverty
COMPARE
Menominee
Trinidadian and Tobagonian
Female Poverty
Female Poverty Comparison
Menominee
Trinidadians and Tobagonians
17.6%
FEMALE POVERTY
0.0/ 100
METRIC RATING
322nd/ 347
METRIC RANK
15.4%
FEMALE POVERTY
0.2/ 100
METRIC RATING
254th/ 347
METRIC RANK
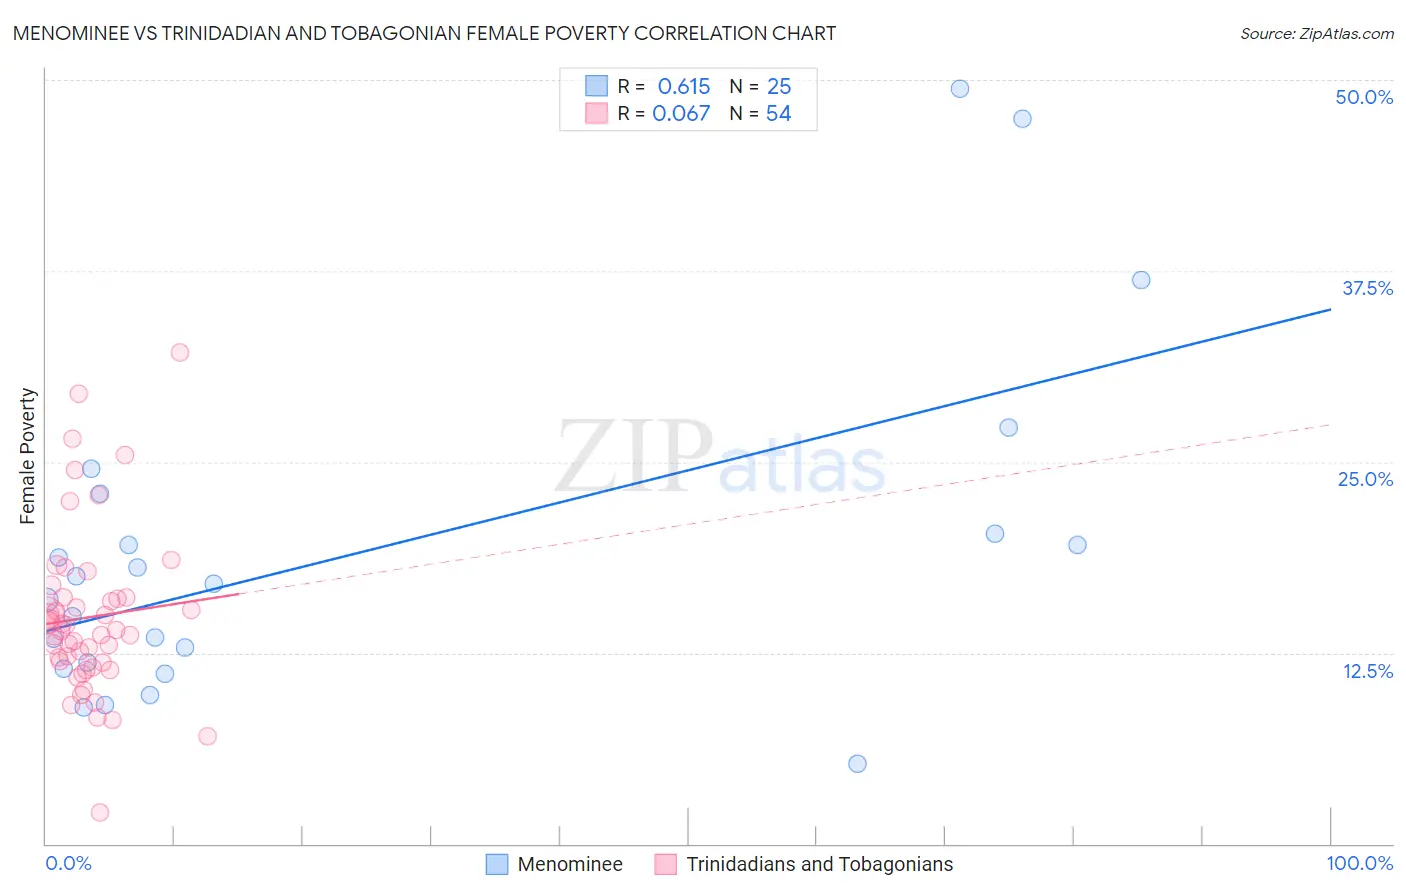
Menominee vs Trinidadian and Tobagonian Female Poverty Correlation Chart
The statistical analysis conducted on geographies consisting of 45,777,591 people shows a significant positive correlation between the proportion of Menominee and poverty level among females in the United States with a correlation coefficient (R) of 0.615 and weighted average of 17.6%. Similarly, the statistical analysis conducted on geographies consisting of 219,692,358 people shows a slight positive correlation between the proportion of Trinidadians and Tobagonians and poverty level among females in the United States with a correlation coefficient (R) of 0.067 and weighted average of 15.4%, a difference of 14.0%.
Female Poverty Correlation Summary
| Measurement | Menominee | Trinidadian and Tobagonian |
| Minimum | 5.2% | 2.0% |
| Maximum | 49.5% | 32.1% |
| Range | 44.2% | 30.1% |
| Mean | 19.1% | 14.8% |
| Median | 17.0% | 13.9% |
| Interquartile 25% (IQ1) | 11.7% | 11.9% |
| Interquartile 75% (IQ3) | 21.6% | 16.1% |
| Interquartile Range (IQR) | 10.0% | 4.2% |
| Standard Deviation (Sample) | 11.1% | 5.5% |
| Standard Deviation (Population) | 10.9% | 5.4% |
Similar Demographics by Female Poverty
Demographics Similar to Menominee by Female Poverty
In terms of female poverty, the demographic groups most similar to Menominee are Paiute (17.7%, a difference of 0.59%), Arapaho (17.5%, a difference of 0.65%), Immigrants from Dominica (17.5%, a difference of 0.72%), Immigrants from Honduras (17.7%, a difference of 0.77%), and Cajun (17.5%, a difference of 0.80%).
| Demographics | Rating | Rank | Female Poverty |
| U.S. Virgin Islanders | 0.0 /100 | #315 | Tragic 17.3% |
| Hondurans | 0.0 /100 | #316 | Tragic 17.4% |
| Immigrants | Congo | 0.0 /100 | #317 | Tragic 17.4% |
| Ute | 0.0 /100 | #318 | Tragic 17.5% |
| Cajuns | 0.0 /100 | #319 | Tragic 17.5% |
| Immigrants | Dominica | 0.0 /100 | #320 | Tragic 17.5% |
| Arapaho | 0.0 /100 | #321 | Tragic 17.5% |
| Menominee | 0.0 /100 | #322 | Tragic 17.6% |
| Paiute | 0.0 /100 | #323 | Tragic 17.7% |
| Immigrants | Honduras | 0.0 /100 | #324 | Tragic 17.7% |
| Colville | 0.0 /100 | #325 | Tragic 17.8% |
| Central American Indians | 0.0 /100 | #326 | Tragic 18.0% |
| Yakama | 0.0 /100 | #327 | Tragic 18.0% |
| Blacks/African Americans | 0.0 /100 | #328 | Tragic 18.6% |
| Kiowa | 0.0 /100 | #329 | Tragic 18.6% |
Demographics Similar to Trinidadians and Tobagonians by Female Poverty
In terms of female poverty, the demographic groups most similar to Trinidadians and Tobagonians are Liberian (15.4%, a difference of 0.24%), Ottawa (15.5%, a difference of 0.31%), Immigrants from Burma/Myanmar (15.4%, a difference of 0.50%), Immigrants from Trinidad and Tobago (15.4%, a difference of 0.53%), and Jamaican (15.5%, a difference of 0.61%).
| Demographics | Rating | Rank | Female Poverty |
| Potawatomi | 0.3 /100 | #247 | Tragic 15.3% |
| Immigrants | Ghana | 0.3 /100 | #248 | Tragic 15.3% |
| Salvadorans | 0.3 /100 | #249 | Tragic 15.3% |
| Immigrants | Western Africa | 0.3 /100 | #250 | Tragic 15.3% |
| Immigrants | Trinidad and Tobago | 0.3 /100 | #251 | Tragic 15.4% |
| Immigrants | Burma/Myanmar | 0.3 /100 | #252 | Tragic 15.4% |
| Liberians | 0.2 /100 | #253 | Tragic 15.4% |
| Trinidadians and Tobagonians | 0.2 /100 | #254 | Tragic 15.4% |
| Ottawa | 0.2 /100 | #255 | Tragic 15.5% |
| Jamaicans | 0.2 /100 | #256 | Tragic 15.5% |
| Immigrants | Jamaica | 0.1 /100 | #257 | Tragic 15.6% |
| Shoshone | 0.1 /100 | #258 | Tragic 15.6% |
| Cape Verdeans | 0.1 /100 | #259 | Tragic 15.6% |
| Immigrants | Guyana | 0.1 /100 | #260 | Tragic 15.6% |
| Guyanese | 0.1 /100 | #261 | Tragic 15.6% |