Immigrants from Austria vs Trinidadian and Tobagonian Female Poverty
COMPARE
Immigrants from Austria
Trinidadian and Tobagonian
Female Poverty
Female Poverty Comparison
Immigrants from Austria
Trinidadians and Tobagonians
12.0%
FEMALE POVERTY
98.7/ 100
METRIC RATING
53rd/ 347
METRIC RANK
15.4%
FEMALE POVERTY
0.2/ 100
METRIC RATING
254th/ 347
METRIC RANK
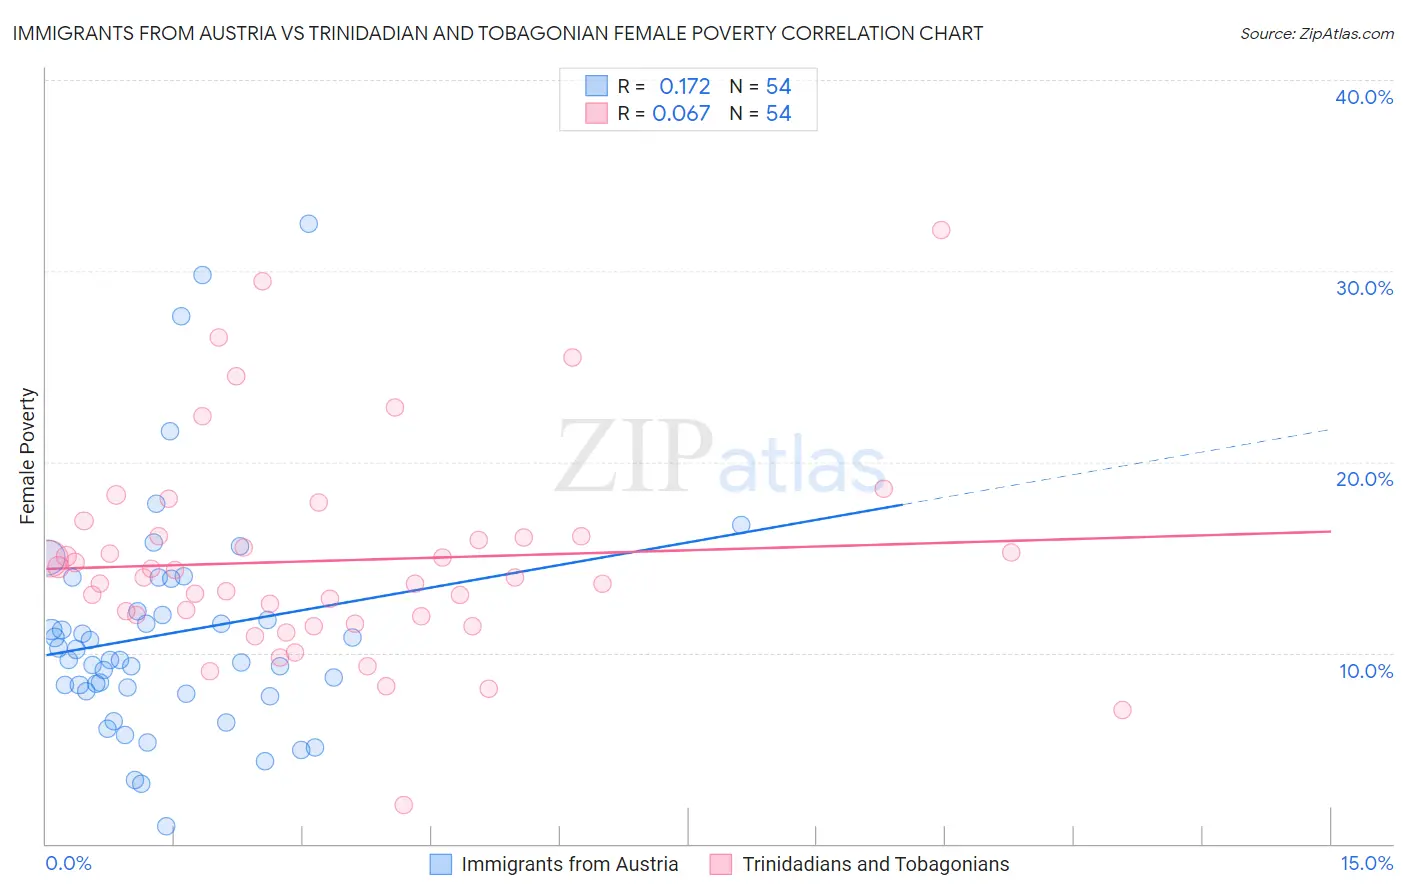
Immigrants from Austria vs Trinidadian and Tobagonian Female Poverty Correlation Chart
The statistical analysis conducted on geographies consisting of 167,923,164 people shows a poor positive correlation between the proportion of Immigrants from Austria and poverty level among females in the United States with a correlation coefficient (R) of 0.172 and weighted average of 12.0%. Similarly, the statistical analysis conducted on geographies consisting of 219,692,358 people shows a slight positive correlation between the proportion of Trinidadians and Tobagonians and poverty level among females in the United States with a correlation coefficient (R) of 0.067 and weighted average of 15.4%, a difference of 28.3%.
Female Poverty Correlation Summary
| Measurement | Immigrants from Austria | Trinidadian and Tobagonian |
| Minimum | 0.92% | 2.0% |
| Maximum | 32.5% | 32.1% |
| Range | 31.6% | 30.1% |
| Mean | 11.0% | 14.8% |
| Median | 9.6% | 13.9% |
| Interquartile 25% (IQ1) | 8.0% | 11.9% |
| Interquartile 75% (IQ3) | 12.2% | 16.1% |
| Interquartile Range (IQR) | 4.2% | 4.2% |
| Standard Deviation (Sample) | 6.0% | 5.5% |
| Standard Deviation (Population) | 6.0% | 5.4% |
Similar Demographics by Female Poverty
Demographics Similar to Immigrants from Austria by Female Poverty
In terms of female poverty, the demographic groups most similar to Immigrants from Austria are Immigrants from Croatia (12.0%, a difference of 0.010%), Immigrants from Philippines (12.1%, a difference of 0.14%), Immigrants from Bulgaria (12.0%, a difference of 0.31%), Immigrants from Sri Lanka (12.1%, a difference of 0.50%), and Slovene (12.0%, a difference of 0.53%).
| Demographics | Rating | Rank | Female Poverty |
| Turks | 99.2 /100 | #46 | Exceptional 11.9% |
| Asians | 99.1 /100 | #47 | Exceptional 11.9% |
| Immigrants | Japan | 99.0 /100 | #48 | Exceptional 11.9% |
| Immigrants | Romania | 99.0 /100 | #49 | Exceptional 12.0% |
| Slovenes | 98.9 /100 | #50 | Exceptional 12.0% |
| Immigrants | Bulgaria | 98.9 /100 | #51 | Exceptional 12.0% |
| Immigrants | Croatia | 98.7 /100 | #52 | Exceptional 12.0% |
| Immigrants | Austria | 98.7 /100 | #53 | Exceptional 12.0% |
| Immigrants | Philippines | 98.7 /100 | #54 | Exceptional 12.1% |
| Immigrants | Sri Lanka | 98.5 /100 | #55 | Exceptional 12.1% |
| Estonians | 98.3 /100 | #56 | Exceptional 12.1% |
| Immigrants | Serbia | 98.3 /100 | #57 | Exceptional 12.1% |
| Scandinavians | 98.2 /100 | #58 | Exceptional 12.1% |
| Immigrants | Europe | 98.2 /100 | #59 | Exceptional 12.1% |
| Immigrants | Australia | 98.1 /100 | #60 | Exceptional 12.2% |
Demographics Similar to Trinidadians and Tobagonians by Female Poverty
In terms of female poverty, the demographic groups most similar to Trinidadians and Tobagonians are Liberian (15.4%, a difference of 0.24%), Ottawa (15.5%, a difference of 0.31%), Immigrants from Burma/Myanmar (15.4%, a difference of 0.50%), Immigrants from Trinidad and Tobago (15.4%, a difference of 0.53%), and Jamaican (15.5%, a difference of 0.61%).
| Demographics | Rating | Rank | Female Poverty |
| Potawatomi | 0.3 /100 | #247 | Tragic 15.3% |
| Immigrants | Ghana | 0.3 /100 | #248 | Tragic 15.3% |
| Salvadorans | 0.3 /100 | #249 | Tragic 15.3% |
| Immigrants | Western Africa | 0.3 /100 | #250 | Tragic 15.3% |
| Immigrants | Trinidad and Tobago | 0.3 /100 | #251 | Tragic 15.4% |
| Immigrants | Burma/Myanmar | 0.3 /100 | #252 | Tragic 15.4% |
| Liberians | 0.2 /100 | #253 | Tragic 15.4% |
| Trinidadians and Tobagonians | 0.2 /100 | #254 | Tragic 15.4% |
| Ottawa | 0.2 /100 | #255 | Tragic 15.5% |
| Jamaicans | 0.2 /100 | #256 | Tragic 15.5% |
| Immigrants | Jamaica | 0.1 /100 | #257 | Tragic 15.6% |
| Shoshone | 0.1 /100 | #258 | Tragic 15.6% |
| Cape Verdeans | 0.1 /100 | #259 | Tragic 15.6% |
| Immigrants | Guyana | 0.1 /100 | #260 | Tragic 15.6% |
| Guyanese | 0.1 /100 | #261 | Tragic 15.6% |