Scandinavian vs Costa Rican Female Poverty
COMPARE
Scandinavian
Costa Rican
Female Poverty
Female Poverty Comparison
Scandinavians
Costa Ricans
12.1%
FEMALE POVERTY
98.2/ 100
METRIC RATING
58th/ 347
METRIC RANK
13.3%
FEMALE POVERTY
63.6/ 100
METRIC RATING
159th/ 347
METRIC RANK
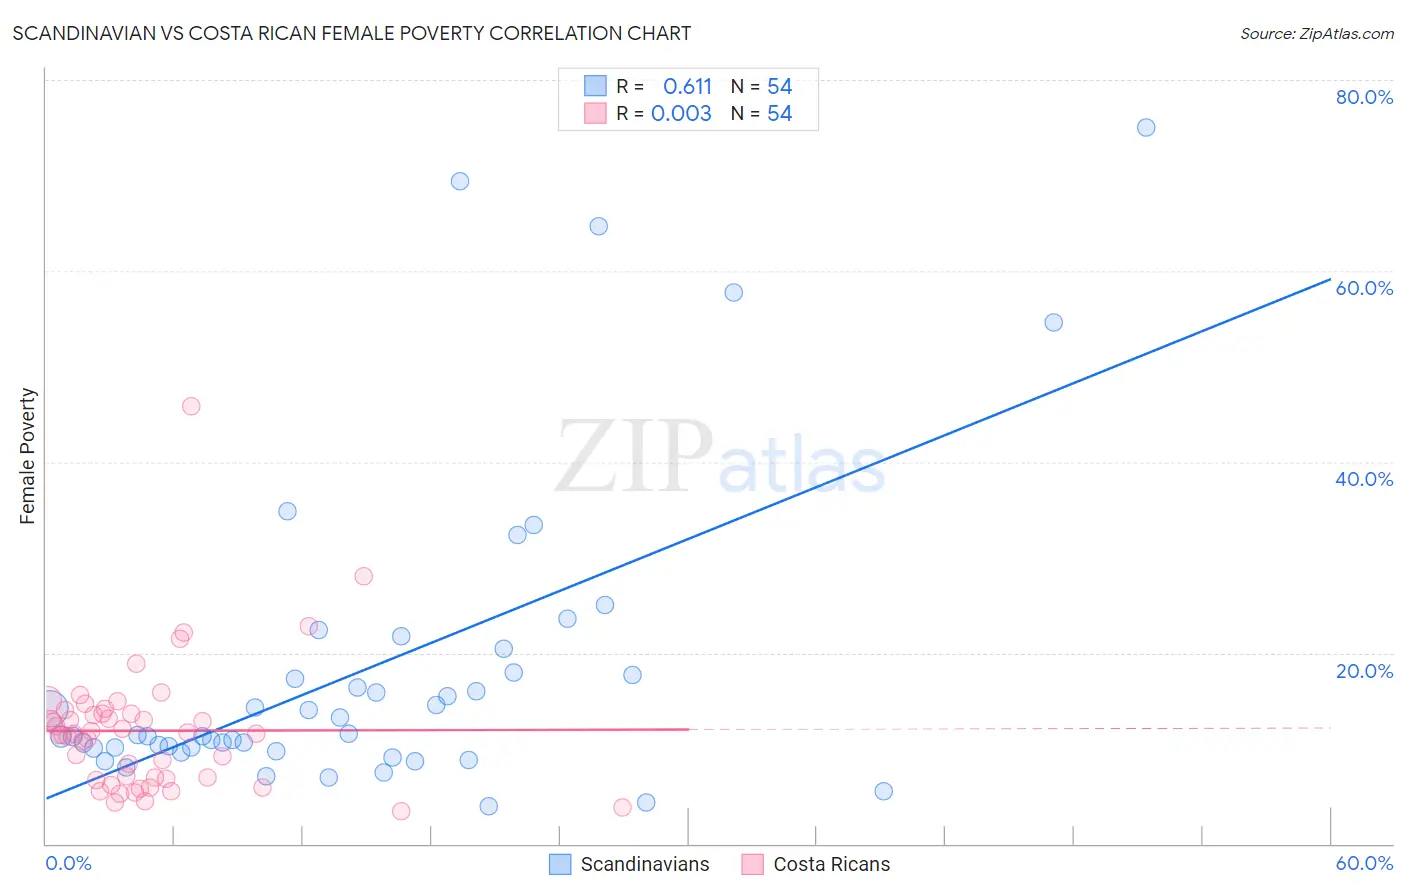
Scandinavian vs Costa Rican Female Poverty Correlation Chart
The statistical analysis conducted on geographies consisting of 472,075,178 people shows a significant positive correlation between the proportion of Scandinavians and poverty level among females in the United States with a correlation coefficient (R) of 0.611 and weighted average of 12.1%. Similarly, the statistical analysis conducted on geographies consisting of 253,437,784 people shows no correlation between the proportion of Costa Ricans and poverty level among females in the United States with a correlation coefficient (R) of 0.003 and weighted average of 13.3%, a difference of 9.2%.
Female Poverty Correlation Summary
| Measurement | Scandinavian | Costa Rican |
| Minimum | 3.9% | 3.4% |
| Maximum | 75.0% | 45.8% |
| Range | 71.1% | 42.4% |
| Mean | 18.4% | 11.8% |
| Median | 11.3% | 11.5% |
| Interquartile 25% (IQ1) | 10.0% | 6.8% |
| Interquartile 75% (IQ3) | 18.0% | 13.6% |
| Interquartile Range (IQR) | 7.9% | 6.8% |
| Standard Deviation (Sample) | 16.4% | 7.0% |
| Standard Deviation (Population) | 16.2% | 6.9% |
Similar Demographics by Female Poverty
Demographics Similar to Scandinavians by Female Poverty
In terms of female poverty, the demographic groups most similar to Scandinavians are Immigrants from Europe (12.1%, a difference of 0.010%), Immigrants from Serbia (12.1%, a difference of 0.080%), Estonian (12.1%, a difference of 0.14%), Immigrants from Australia (12.2%, a difference of 0.25%), and Immigrants from Asia (12.2%, a difference of 0.26%).
| Demographics | Rating | Rank | Female Poverty |
| Immigrants | Bulgaria | 98.9 /100 | #51 | Exceptional 12.0% |
| Immigrants | Croatia | 98.7 /100 | #52 | Exceptional 12.0% |
| Immigrants | Austria | 98.7 /100 | #53 | Exceptional 12.0% |
| Immigrants | Philippines | 98.7 /100 | #54 | Exceptional 12.1% |
| Immigrants | Sri Lanka | 98.5 /100 | #55 | Exceptional 12.1% |
| Estonians | 98.3 /100 | #56 | Exceptional 12.1% |
| Immigrants | Serbia | 98.3 /100 | #57 | Exceptional 12.1% |
| Scandinavians | 98.2 /100 | #58 | Exceptional 12.1% |
| Immigrants | Europe | 98.2 /100 | #59 | Exceptional 12.1% |
| Immigrants | Australia | 98.1 /100 | #60 | Exceptional 12.2% |
| Immigrants | Asia | 98.1 /100 | #61 | Exceptional 12.2% |
| Immigrants | Italy | 98.0 /100 | #62 | Exceptional 12.2% |
| Ukrainians | 98.0 /100 | #63 | Exceptional 12.2% |
| Germans | 98.0 /100 | #64 | Exceptional 12.2% |
| Indians (Asian) | 97.9 /100 | #65 | Exceptional 12.2% |
Demographics Similar to Costa Ricans by Female Poverty
In terms of female poverty, the demographic groups most similar to Costa Ricans are Immigrants from Nepal (13.3%, a difference of 0.090%), Immigrants from Ethiopia (13.3%, a difference of 0.12%), Guamanian/Chamorro (13.3%, a difference of 0.12%), Immigrants from Albania (13.3%, a difference of 0.13%), and Ethiopian (13.3%, a difference of 0.14%).
| Demographics | Rating | Rank | Female Poverty |
| Samoans | 73.6 /100 | #152 | Good 13.1% |
| Immigrants | Fiji | 71.0 /100 | #153 | Good 13.2% |
| Armenians | 70.4 /100 | #154 | Good 13.2% |
| Hungarians | 70.1 /100 | #155 | Good 13.2% |
| Immigrants | Bosnia and Herzegovina | 69.7 /100 | #156 | Good 13.2% |
| Immigrants | Northern Africa | 68.8 /100 | #157 | Good 13.2% |
| Pennsylvania Germans | 67.3 /100 | #158 | Good 13.2% |
| Costa Ricans | 63.6 /100 | #159 | Good 13.3% |
| Immigrants | Nepal | 62.7 /100 | #160 | Good 13.3% |
| Immigrants | Ethiopia | 62.5 /100 | #161 | Good 13.3% |
| Guamanians/Chamorros | 62.4 /100 | #162 | Good 13.3% |
| Immigrants | Albania | 62.4 /100 | #163 | Good 13.3% |
| Ethiopians | 62.3 /100 | #164 | Good 13.3% |
| Scotch-Irish | 62.1 /100 | #165 | Good 13.3% |
| Immigrants | Oceania | 59.7 /100 | #166 | Average 13.3% |