Scandinavian vs Immigrants from Latvia Female Poverty
COMPARE
Scandinavian
Immigrants from Latvia
Female Poverty
Female Poverty Comparison
Scandinavians
Immigrants from Latvia
12.1%
FEMALE POVERTY
98.2/ 100
METRIC RATING
58th/ 347
METRIC RANK
12.5%
FEMALE POVERTY
94.8/ 100
METRIC RATING
100th/ 347
METRIC RANK
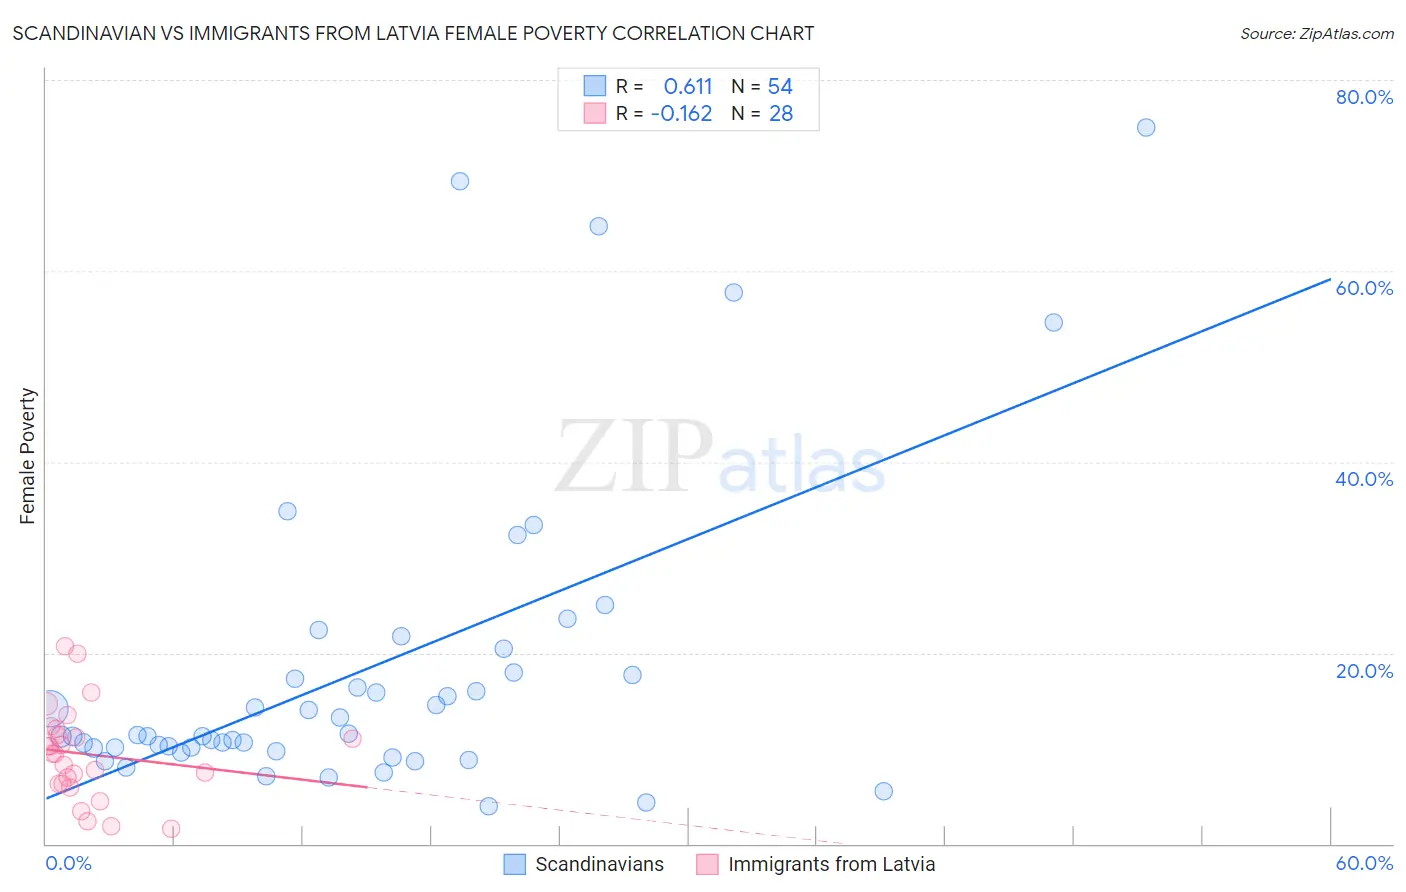
Scandinavian vs Immigrants from Latvia Female Poverty Correlation Chart
The statistical analysis conducted on geographies consisting of 472,075,178 people shows a significant positive correlation between the proportion of Scandinavians and poverty level among females in the United States with a correlation coefficient (R) of 0.611 and weighted average of 12.1%. Similarly, the statistical analysis conducted on geographies consisting of 113,716,282 people shows a poor negative correlation between the proportion of Immigrants from Latvia and poverty level among females in the United States with a correlation coefficient (R) of -0.162 and weighted average of 12.5%, a difference of 2.9%.
Female Poverty Correlation Summary
| Measurement | Scandinavian | Immigrants from Latvia |
| Minimum | 3.9% | 1.6% |
| Maximum | 75.0% | 20.7% |
| Range | 71.1% | 19.1% |
| Mean | 18.4% | 9.4% |
| Median | 11.3% | 9.4% |
| Interquartile 25% (IQ1) | 10.0% | 6.3% |
| Interquartile 75% (IQ3) | 18.0% | 11.8% |
| Interquartile Range (IQR) | 7.9% | 5.5% |
| Standard Deviation (Sample) | 16.4% | 4.8% |
| Standard Deviation (Population) | 16.2% | 4.7% |
Similar Demographics by Female Poverty
Demographics Similar to Scandinavians by Female Poverty
In terms of female poverty, the demographic groups most similar to Scandinavians are Immigrants from Europe (12.1%, a difference of 0.010%), Immigrants from Serbia (12.1%, a difference of 0.080%), Estonian (12.1%, a difference of 0.14%), Immigrants from Australia (12.2%, a difference of 0.25%), and Immigrants from Asia (12.2%, a difference of 0.26%).
| Demographics | Rating | Rank | Female Poverty |
| Immigrants | Bulgaria | 98.9 /100 | #51 | Exceptional 12.0% |
| Immigrants | Croatia | 98.7 /100 | #52 | Exceptional 12.0% |
| Immigrants | Austria | 98.7 /100 | #53 | Exceptional 12.0% |
| Immigrants | Philippines | 98.7 /100 | #54 | Exceptional 12.1% |
| Immigrants | Sri Lanka | 98.5 /100 | #55 | Exceptional 12.1% |
| Estonians | 98.3 /100 | #56 | Exceptional 12.1% |
| Immigrants | Serbia | 98.3 /100 | #57 | Exceptional 12.1% |
| Scandinavians | 98.2 /100 | #58 | Exceptional 12.1% |
| Immigrants | Europe | 98.2 /100 | #59 | Exceptional 12.1% |
| Immigrants | Australia | 98.1 /100 | #60 | Exceptional 12.2% |
| Immigrants | Asia | 98.1 /100 | #61 | Exceptional 12.2% |
| Immigrants | Italy | 98.0 /100 | #62 | Exceptional 12.2% |
| Ukrainians | 98.0 /100 | #63 | Exceptional 12.2% |
| Germans | 98.0 /100 | #64 | Exceptional 12.2% |
| Indians (Asian) | 97.9 /100 | #65 | Exceptional 12.2% |
Demographics Similar to Immigrants from Latvia by Female Poverty
In terms of female poverty, the demographic groups most similar to Immigrants from Latvia are Tlingit-Haida (12.5%, a difference of 0.0%), Romanian (12.5%, a difference of 0.15%), Immigrants from China (12.5%, a difference of 0.15%), Native Hawaiian (12.5%, a difference of 0.17%), and Slavic (12.5%, a difference of 0.17%).
| Demographics | Rating | Rank | Female Poverty |
| Immigrants | Egypt | 95.5 /100 | #93 | Exceptional 12.5% |
| Immigrants | Indonesia | 95.4 /100 | #94 | Exceptional 12.5% |
| Immigrants | South Africa | 95.4 /100 | #95 | Exceptional 12.5% |
| British | 95.2 /100 | #96 | Exceptional 12.5% |
| Australians | 95.2 /100 | #97 | Exceptional 12.5% |
| Native Hawaiians | 95.1 /100 | #98 | Exceptional 12.5% |
| Romanians | 95.1 /100 | #99 | Exceptional 12.5% |
| Immigrants | Latvia | 94.8 /100 | #100 | Exceptional 12.5% |
| Tlingit-Haida | 94.8 /100 | #101 | Exceptional 12.5% |
| Immigrants | China | 94.5 /100 | #102 | Exceptional 12.5% |
| Slavs | 94.5 /100 | #103 | Exceptional 12.5% |
| Palestinians | 94.3 /100 | #104 | Exceptional 12.5% |
| Scottish | 94.1 /100 | #105 | Exceptional 12.5% |
| Immigrants | Turkey | 93.8 /100 | #106 | Exceptional 12.6% |
| Laotians | 93.4 /100 | #107 | Exceptional 12.6% |