Portuguese vs Trinidadian and Tobagonian Female Poverty
COMPARE
Portuguese
Trinidadian and Tobagonian
Female Poverty
Female Poverty Comparison
Portuguese
Trinidadians and Tobagonians
12.6%
FEMALE POVERTY
93.1/ 100
METRIC RATING
108th/ 347
METRIC RANK
15.4%
FEMALE POVERTY
0.2/ 100
METRIC RATING
254th/ 347
METRIC RANK
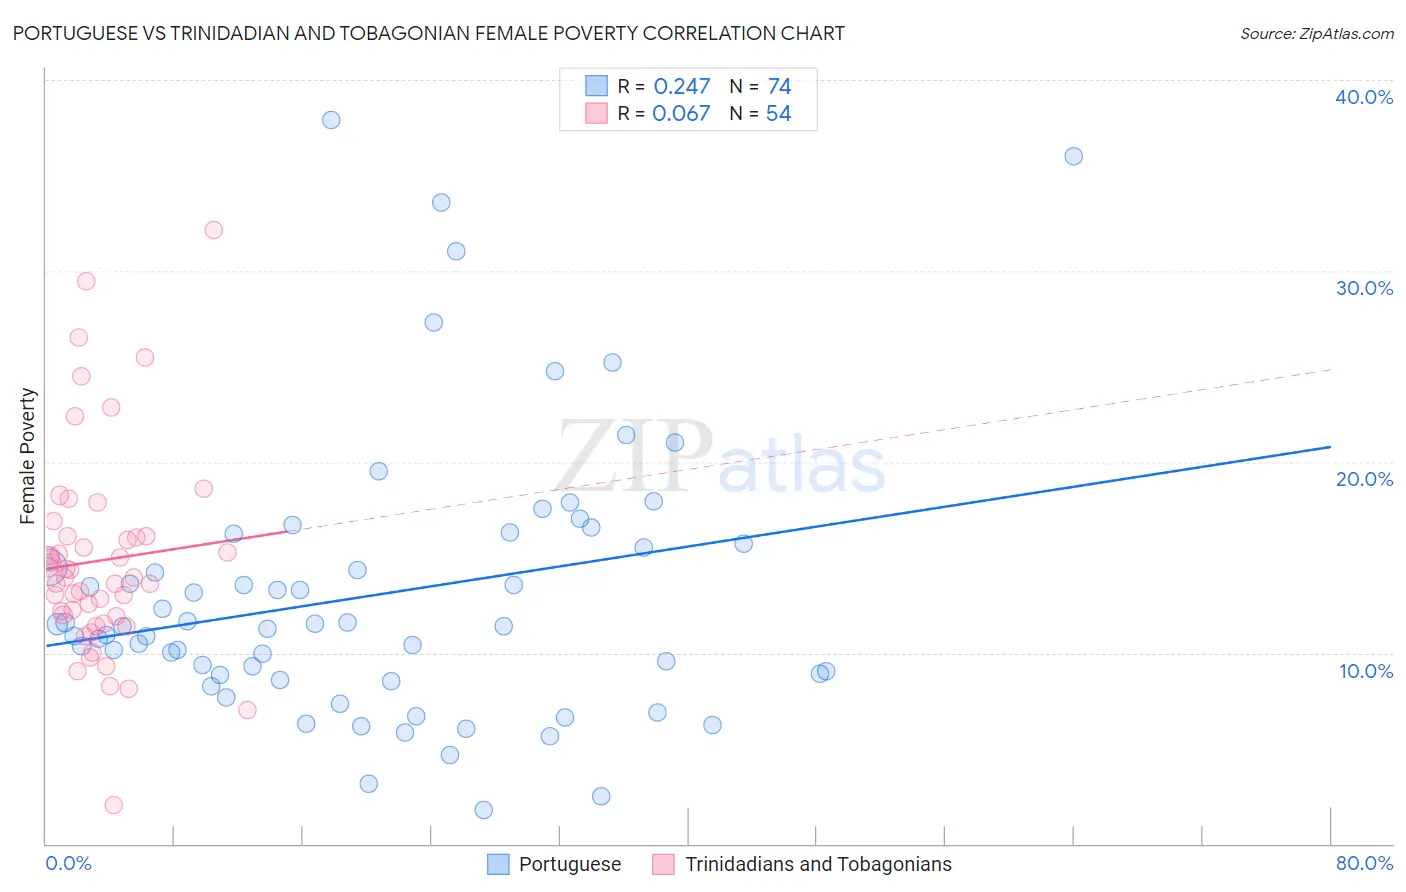
Portuguese vs Trinidadian and Tobagonian Female Poverty Correlation Chart
The statistical analysis conducted on geographies consisting of 449,805,849 people shows a weak positive correlation between the proportion of Portuguese and poverty level among females in the United States with a correlation coefficient (R) of 0.247 and weighted average of 12.6%. Similarly, the statistical analysis conducted on geographies consisting of 219,692,358 people shows a slight positive correlation between the proportion of Trinidadians and Tobagonians and poverty level among females in the United States with a correlation coefficient (R) of 0.067 and weighted average of 15.4%, a difference of 22.6%.
Female Poverty Correlation Summary
| Measurement | Portuguese | Trinidadian and Tobagonian |
| Minimum | 1.8% | 2.0% |
| Maximum | 37.9% | 32.1% |
| Range | 36.1% | 30.1% |
| Mean | 13.0% | 14.8% |
| Median | 11.4% | 13.9% |
| Interquartile 25% (IQ1) | 8.8% | 11.9% |
| Interquartile 75% (IQ3) | 15.7% | 16.1% |
| Interquartile Range (IQR) | 6.9% | 4.2% |
| Standard Deviation (Sample) | 7.2% | 5.5% |
| Standard Deviation (Population) | 7.2% | 5.4% |
Similar Demographics by Female Poverty
Demographics Similar to Portuguese by Female Poverty
In terms of female poverty, the demographic groups most similar to Portuguese are Immigrants from Zimbabwe (12.6%, a difference of 0.020%), Paraguayan (12.6%, a difference of 0.040%), Laotian (12.6%, a difference of 0.10%), Soviet Union (12.6%, a difference of 0.27%), and Immigrants from Turkey (12.6%, a difference of 0.29%).
| Demographics | Rating | Rank | Female Poverty |
| Tlingit-Haida | 94.8 /100 | #101 | Exceptional 12.5% |
| Immigrants | China | 94.5 /100 | #102 | Exceptional 12.5% |
| Slavs | 94.5 /100 | #103 | Exceptional 12.5% |
| Palestinians | 94.3 /100 | #104 | Exceptional 12.5% |
| Scottish | 94.1 /100 | #105 | Exceptional 12.5% |
| Immigrants | Turkey | 93.8 /100 | #106 | Exceptional 12.6% |
| Laotians | 93.4 /100 | #107 | Exceptional 12.6% |
| Portuguese | 93.1 /100 | #108 | Exceptional 12.6% |
| Immigrants | Zimbabwe | 93.1 /100 | #109 | Exceptional 12.6% |
| Paraguayans | 93.0 /100 | #110 | Exceptional 12.6% |
| Soviet Union | 92.4 /100 | #111 | Exceptional 12.6% |
| Immigrants | Israel | 92.0 /100 | #112 | Exceptional 12.6% |
| Canadians | 92.0 /100 | #113 | Exceptional 12.7% |
| Welsh | 91.6 /100 | #114 | Exceptional 12.7% |
| Puget Sound Salish | 91.5 /100 | #115 | Exceptional 12.7% |
Demographics Similar to Trinidadians and Tobagonians by Female Poverty
In terms of female poverty, the demographic groups most similar to Trinidadians and Tobagonians are Liberian (15.4%, a difference of 0.24%), Ottawa (15.5%, a difference of 0.31%), Immigrants from Burma/Myanmar (15.4%, a difference of 0.50%), Immigrants from Trinidad and Tobago (15.4%, a difference of 0.53%), and Jamaican (15.5%, a difference of 0.61%).
| Demographics | Rating | Rank | Female Poverty |
| Potawatomi | 0.3 /100 | #247 | Tragic 15.3% |
| Immigrants | Ghana | 0.3 /100 | #248 | Tragic 15.3% |
| Salvadorans | 0.3 /100 | #249 | Tragic 15.3% |
| Immigrants | Western Africa | 0.3 /100 | #250 | Tragic 15.3% |
| Immigrants | Trinidad and Tobago | 0.3 /100 | #251 | Tragic 15.4% |
| Immigrants | Burma/Myanmar | 0.3 /100 | #252 | Tragic 15.4% |
| Liberians | 0.2 /100 | #253 | Tragic 15.4% |
| Trinidadians and Tobagonians | 0.2 /100 | #254 | Tragic 15.4% |
| Ottawa | 0.2 /100 | #255 | Tragic 15.5% |
| Jamaicans | 0.2 /100 | #256 | Tragic 15.5% |
| Immigrants | Jamaica | 0.1 /100 | #257 | Tragic 15.6% |
| Shoshone | 0.1 /100 | #258 | Tragic 15.6% |
| Cape Verdeans | 0.1 /100 | #259 | Tragic 15.6% |
| Immigrants | Guyana | 0.1 /100 | #260 | Tragic 15.6% |
| Guyanese | 0.1 /100 | #261 | Tragic 15.6% |