Fijian vs Immigrants from Latvia Female Poverty
COMPARE
Fijian
Immigrants from Latvia
Female Poverty
Female Poverty Comparison
Fijians
Immigrants from Latvia
14.9%
FEMALE POVERTY
1.1/ 100
METRIC RATING
234th/ 347
METRIC RANK
12.5%
FEMALE POVERTY
94.8/ 100
METRIC RATING
100th/ 347
METRIC RANK
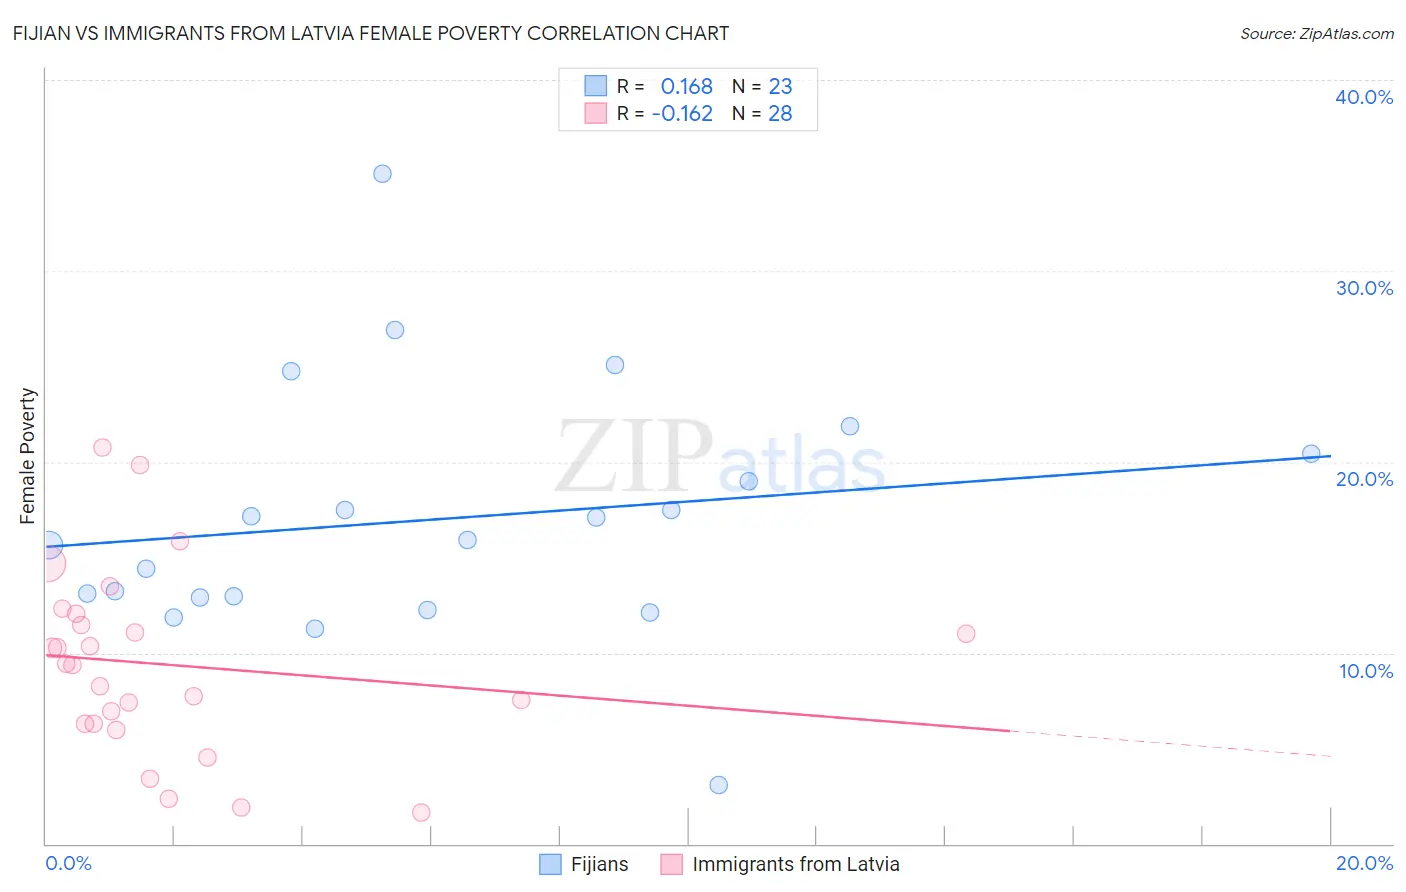
Fijian vs Immigrants from Latvia Female Poverty Correlation Chart
The statistical analysis conducted on geographies consisting of 55,946,752 people shows a poor positive correlation between the proportion of Fijians and poverty level among females in the United States with a correlation coefficient (R) of 0.168 and weighted average of 14.9%. Similarly, the statistical analysis conducted on geographies consisting of 113,716,282 people shows a poor negative correlation between the proportion of Immigrants from Latvia and poverty level among females in the United States with a correlation coefficient (R) of -0.162 and weighted average of 12.5%, a difference of 19.2%.
Female Poverty Correlation Summary
| Measurement | Fijian | Immigrants from Latvia |
| Minimum | 3.1% | 1.6% |
| Maximum | 35.1% | 20.7% |
| Range | 32.0% | 19.1% |
| Mean | 17.0% | 9.4% |
| Median | 15.9% | 9.4% |
| Interquartile 25% (IQ1) | 12.9% | 6.3% |
| Interquartile 75% (IQ3) | 20.4% | 11.8% |
| Interquartile Range (IQR) | 7.6% | 5.5% |
| Standard Deviation (Sample) | 6.6% | 4.8% |
| Standard Deviation (Population) | 6.5% | 4.7% |
Similar Demographics by Female Poverty
Demographics Similar to Fijians by Female Poverty
In terms of female poverty, the demographic groups most similar to Fijians are Immigrants from Laos (15.0%, a difference of 0.44%), Immigrants from Saudi Arabia (14.8%, a difference of 0.52%), Osage (14.8%, a difference of 0.62%), Nigerian (14.8%, a difference of 0.93%), and Alaska Native (14.7%, a difference of 1.0%).
| Demographics | Rating | Rank | Female Poverty |
| Immigrants | Nigeria | 2.1 /100 | #227 | Tragic 14.7% |
| German Russians | 2.0 /100 | #228 | Tragic 14.7% |
| Ghanaians | 1.9 /100 | #229 | Tragic 14.7% |
| Alaska Natives | 1.8 /100 | #230 | Tragic 14.7% |
| Nigerians | 1.7 /100 | #231 | Tragic 14.8% |
| Osage | 1.5 /100 | #232 | Tragic 14.8% |
| Immigrants | Saudi Arabia | 1.4 /100 | #233 | Tragic 14.8% |
| Fijians | 1.1 /100 | #234 | Tragic 14.9% |
| Immigrants | Laos | 0.9 /100 | #235 | Tragic 15.0% |
| Cree | 0.7 /100 | #236 | Tragic 15.1% |
| French American Indians | 0.6 /100 | #237 | Tragic 15.1% |
| Immigrants | Armenia | 0.6 /100 | #238 | Tragic 15.1% |
| Immigrants | Middle Africa | 0.5 /100 | #239 | Tragic 15.2% |
| Sudanese | 0.5 /100 | #240 | Tragic 15.2% |
| Immigrants | Sudan | 0.4 /100 | #241 | Tragic 15.2% |
Demographics Similar to Immigrants from Latvia by Female Poverty
In terms of female poverty, the demographic groups most similar to Immigrants from Latvia are Tlingit-Haida (12.5%, a difference of 0.0%), Romanian (12.5%, a difference of 0.15%), Immigrants from China (12.5%, a difference of 0.15%), Native Hawaiian (12.5%, a difference of 0.17%), and Slavic (12.5%, a difference of 0.17%).
| Demographics | Rating | Rank | Female Poverty |
| Immigrants | Egypt | 95.5 /100 | #93 | Exceptional 12.5% |
| Immigrants | Indonesia | 95.4 /100 | #94 | Exceptional 12.5% |
| Immigrants | South Africa | 95.4 /100 | #95 | Exceptional 12.5% |
| British | 95.2 /100 | #96 | Exceptional 12.5% |
| Australians | 95.2 /100 | #97 | Exceptional 12.5% |
| Native Hawaiians | 95.1 /100 | #98 | Exceptional 12.5% |
| Romanians | 95.1 /100 | #99 | Exceptional 12.5% |
| Immigrants | Latvia | 94.8 /100 | #100 | Exceptional 12.5% |
| Tlingit-Haida | 94.8 /100 | #101 | Exceptional 12.5% |
| Immigrants | China | 94.5 /100 | #102 | Exceptional 12.5% |
| Slavs | 94.5 /100 | #103 | Exceptional 12.5% |
| Palestinians | 94.3 /100 | #104 | Exceptional 12.5% |
| Scottish | 94.1 /100 | #105 | Exceptional 12.5% |
| Immigrants | Turkey | 93.8 /100 | #106 | Exceptional 12.6% |
| Laotians | 93.4 /100 | #107 | Exceptional 12.6% |