Cheyenne vs Fijian Receiving Food Stamps
COMPARE
Cheyenne
Fijian
Receiving Food Stamps
Receiving Food Stamps Comparison
Cheyenne
Fijians
14.3%
RECEIVING FOOD STAMPS
0.2/ 100
METRIC RATING
266th/ 347
METRIC RANK
13.0%
RECEIVING FOOD STAMPS
4.3/ 100
METRIC RATING
225th/ 347
METRIC RANK
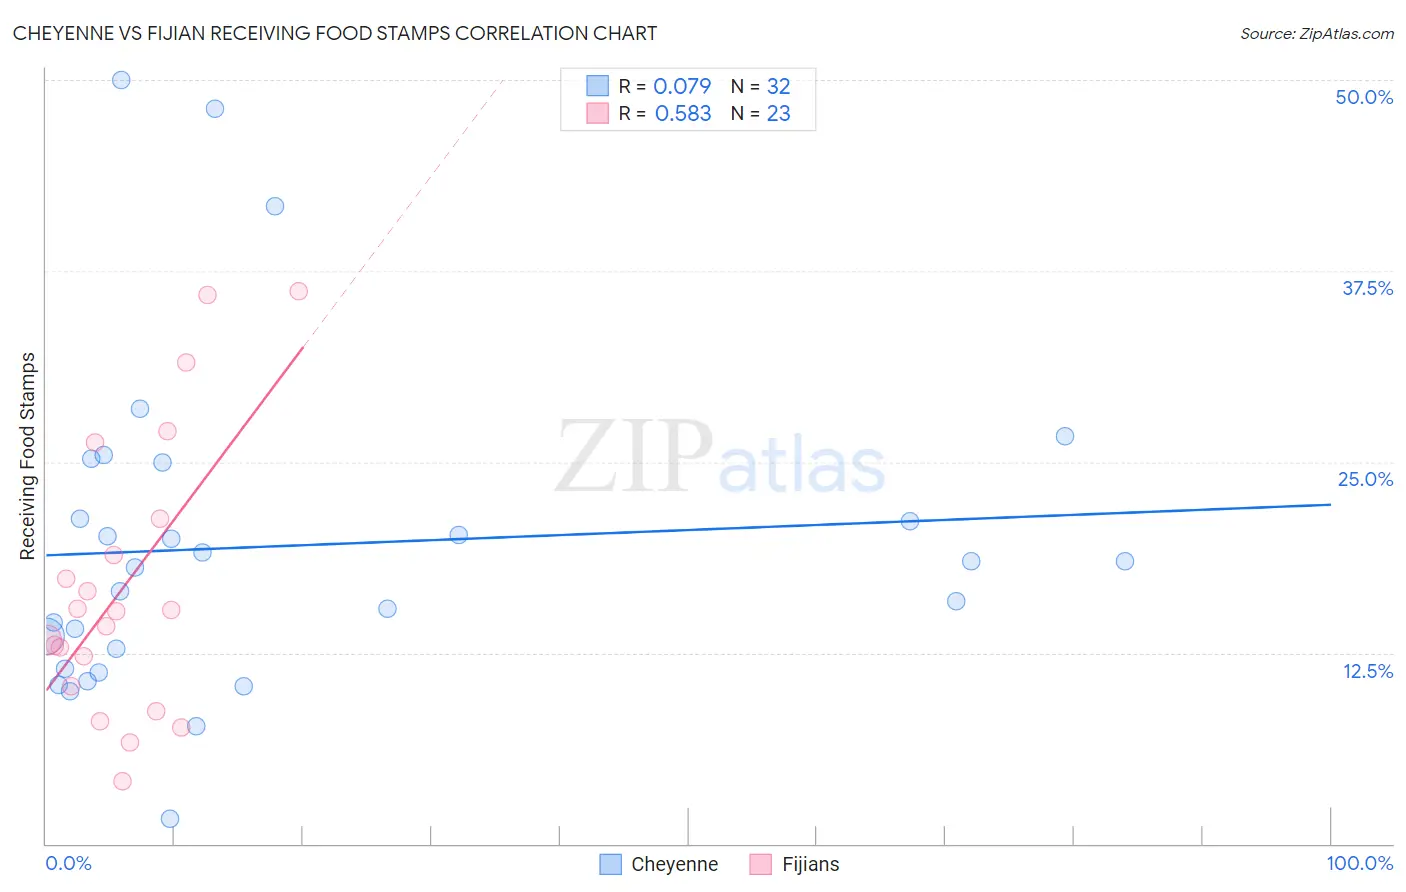
Cheyenne vs Fijian Receiving Food Stamps Correlation Chart
The statistical analysis conducted on geographies consisting of 80,695,470 people shows a slight positive correlation between the proportion of Cheyenne and percentage of population receiving government assistance and/or food stamps in the United States with a correlation coefficient (R) of 0.079 and weighted average of 14.3%. Similarly, the statistical analysis conducted on geographies consisting of 55,945,460 people shows a substantial positive correlation between the proportion of Fijians and percentage of population receiving government assistance and/or food stamps in the United States with a correlation coefficient (R) of 0.583 and weighted average of 13.0%, a difference of 9.8%.
Receiving Food Stamps Correlation Summary
| Measurement | Cheyenne | Fijian |
| Minimum | 1.6% | 4.1% |
| Maximum | 50.0% | 36.2% |
| Range | 48.4% | 32.1% |
| Mean | 19.5% | 16.9% |
| Median | 18.3% | 15.2% |
| Interquartile 25% (IQ1) | 12.1% | 10.3% |
| Interquartile 75% (IQ3) | 23.2% | 21.3% |
| Interquartile Range (IQR) | 11.0% | 11.0% |
| Standard Deviation (Sample) | 10.8% | 9.0% |
| Standard Deviation (Population) | 10.6% | 8.8% |
Similar Demographics by Receiving Food Stamps
Demographics Similar to Cheyenne by Receiving Food Stamps
In terms of receiving food stamps, the demographic groups most similar to Cheyenne are Blackfeet (14.3%, a difference of 0.080%), Immigrants from Uzbekistan (14.3%, a difference of 0.14%), Dutch West Indian (14.3%, a difference of 0.22%), Paiute (14.3%, a difference of 0.23%), and Immigrants from Portugal (14.3%, a difference of 0.23%).
| Demographics | Rating | Rank | Receiving Food Stamps |
| Creek | 0.3 /100 | #259 | Tragic 14.1% |
| Central Americans | 0.3 /100 | #260 | Tragic 14.1% |
| Immigrants | Congo | 0.3 /100 | #261 | Tragic 14.1% |
| Paiute | 0.2 /100 | #262 | Tragic 14.3% |
| Immigrants | Portugal | 0.2 /100 | #263 | Tragic 14.3% |
| Immigrants | Uzbekistan | 0.2 /100 | #264 | Tragic 14.3% |
| Blackfeet | 0.2 /100 | #265 | Tragic 14.3% |
| Cheyenne | 0.2 /100 | #266 | Tragic 14.3% |
| Dutch West Indians | 0.2 /100 | #267 | Tragic 14.3% |
| Guatemalans | 0.1 /100 | #268 | Tragic 14.4% |
| Nepalese | 0.1 /100 | #269 | Tragic 14.6% |
| Mexicans | 0.1 /100 | #270 | Tragic 14.6% |
| Immigrants | Guatemala | 0.1 /100 | #271 | Tragic 14.6% |
| Chippewa | 0.1 /100 | #272 | Tragic 14.7% |
| Alaskan Athabascans | 0.1 /100 | #273 | Tragic 14.7% |
Demographics Similar to Fijians by Receiving Food Stamps
In terms of receiving food stamps, the demographic groups most similar to Fijians are Immigrants from Armenia (13.0%, a difference of 0.020%), Immigrants from Albania (13.0%, a difference of 0.090%), Immigrants (13.0%, a difference of 0.13%), Bermudan (13.0%, a difference of 0.39%), and Chickasaw (13.1%, a difference of 0.60%).
| Demographics | Rating | Rank | Receiving Food Stamps |
| Hawaiians | 5.4 /100 | #218 | Tragic 12.9% |
| Immigrants | Middle Africa | 5.4 /100 | #219 | Tragic 12.9% |
| Immigrants | Colombia | 5.3 /100 | #220 | Tragic 12.9% |
| Bermudans | 4.8 /100 | #221 | Tragic 13.0% |
| Immigrants | Immigrants | 4.4 /100 | #222 | Tragic 13.0% |
| Immigrants | Albania | 4.4 /100 | #223 | Tragic 13.0% |
| Immigrants | Armenia | 4.3 /100 | #224 | Tragic 13.0% |
| Fijians | 4.3 /100 | #225 | Tragic 13.0% |
| Chickasaw | 3.6 /100 | #226 | Tragic 13.1% |
| Nigerians | 3.5 /100 | #227 | Tragic 13.1% |
| Panamanians | 3.5 /100 | #228 | Tragic 13.1% |
| Ottawa | 3.5 /100 | #229 | Tragic 13.1% |
| Puget Sound Salish | 3.4 /100 | #230 | Tragic 13.1% |
| Immigrants | Nigeria | 3.4 /100 | #231 | Tragic 13.1% |
| Salvadorans | 2.7 /100 | #232 | Tragic 13.2% |