Taiwanese vs Fijian Receiving Food Stamps
COMPARE
Taiwanese
Fijian
Receiving Food Stamps
Receiving Food Stamps Comparison
Taiwanese
Fijians
11.0%
RECEIVING FOOD STAMPS
84.2/ 100
METRIC RATING
146th/ 347
METRIC RANK
13.0%
RECEIVING FOOD STAMPS
4.3/ 100
METRIC RATING
225th/ 347
METRIC RANK
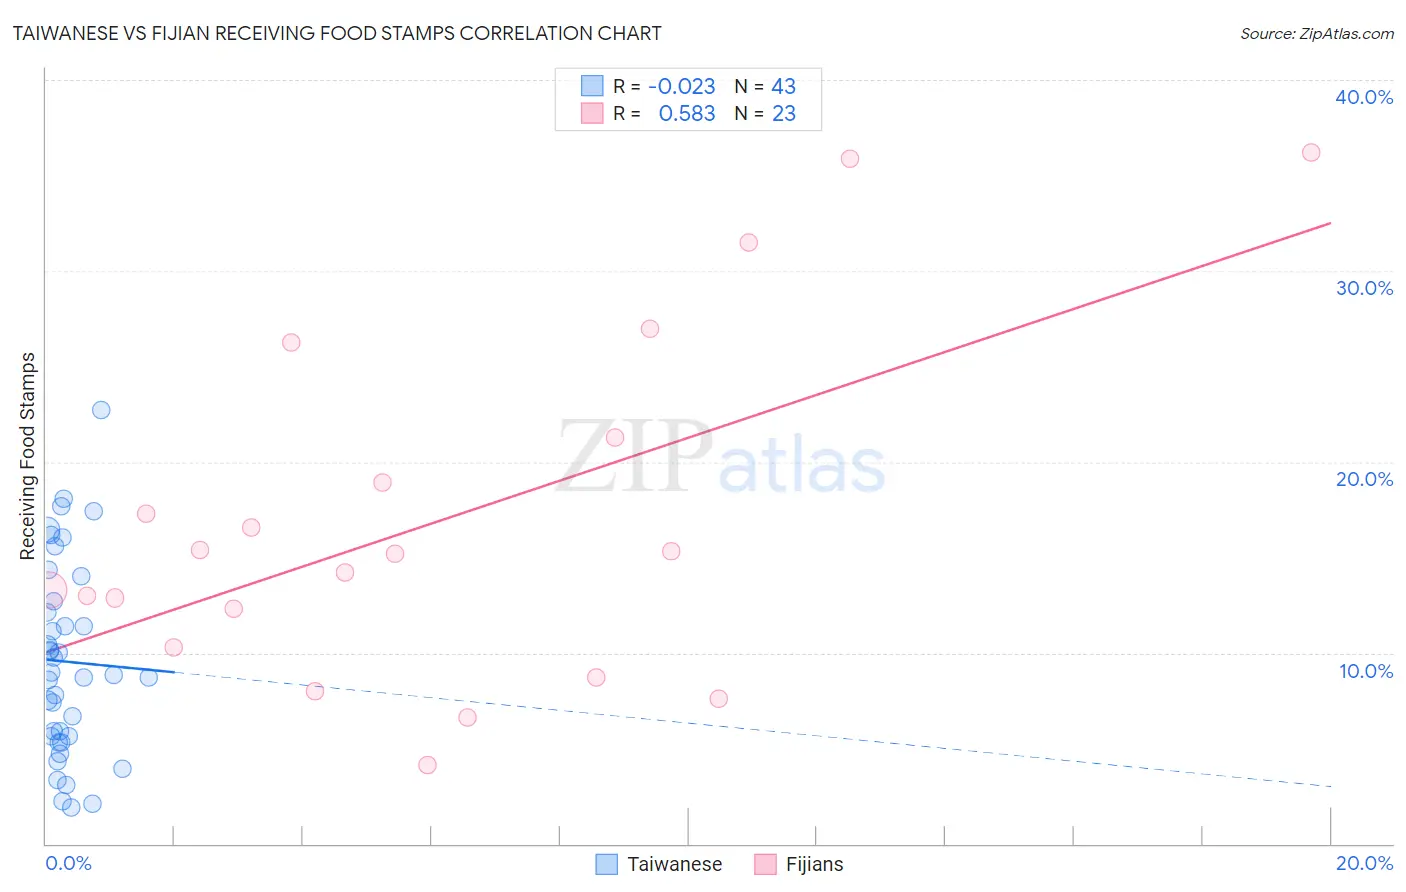
Taiwanese vs Fijian Receiving Food Stamps Correlation Chart
The statistical analysis conducted on geographies consisting of 31,675,875 people shows no correlation between the proportion of Taiwanese and percentage of population receiving government assistance and/or food stamps in the United States with a correlation coefficient (R) of -0.023 and weighted average of 11.0%. Similarly, the statistical analysis conducted on geographies consisting of 55,945,460 people shows a substantial positive correlation between the proportion of Fijians and percentage of population receiving government assistance and/or food stamps in the United States with a correlation coefficient (R) of 0.583 and weighted average of 13.0%, a difference of 17.8%.
Receiving Food Stamps Correlation Summary
| Measurement | Taiwanese | Fijian |
| Minimum | 1.9% | 4.1% |
| Maximum | 22.7% | 36.2% |
| Range | 20.8% | 32.1% |
| Mean | 9.5% | 16.9% |
| Median | 8.8% | 15.2% |
| Interquartile 25% (IQ1) | 5.6% | 10.3% |
| Interquartile 75% (IQ3) | 12.7% | 21.3% |
| Interquartile Range (IQR) | 7.1% | 11.0% |
| Standard Deviation (Sample) | 5.0% | 9.0% |
| Standard Deviation (Population) | 5.0% | 8.8% |
Similar Demographics by Receiving Food Stamps
Demographics Similar to Taiwanese by Receiving Food Stamps
In terms of receiving food stamps, the demographic groups most similar to Taiwanese are White/Caucasian (11.1%, a difference of 0.090%), Hungarian (11.0%, a difference of 0.24%), Immigrants from South Eastern Asia (11.1%, a difference of 0.26%), Brazilian (11.1%, a difference of 0.28%), and Soviet Union (11.1%, a difference of 0.30%).
| Demographics | Rating | Rank | Receiving Food Stamps |
| Hmong | 88.4 /100 | #139 | Excellent 10.9% |
| Celtics | 87.8 /100 | #140 | Excellent 10.9% |
| Immigrants | Vietnam | 86.7 /100 | #141 | Excellent 11.0% |
| Chileans | 86.2 /100 | #142 | Excellent 11.0% |
| Immigrants | Northern Africa | 86.0 /100 | #143 | Excellent 11.0% |
| Syrians | 85.5 /100 | #144 | Excellent 11.0% |
| Hungarians | 85.1 /100 | #145 | Excellent 11.0% |
| Taiwanese | 84.2 /100 | #146 | Excellent 11.0% |
| Whites/Caucasians | 83.9 /100 | #147 | Excellent 11.1% |
| Immigrants | South Eastern Asia | 83.3 /100 | #148 | Excellent 11.1% |
| Brazilians | 83.2 /100 | #149 | Excellent 11.1% |
| Soviet Union | 83.1 /100 | #150 | Excellent 11.1% |
| Immigrants | Spain | 81.7 /100 | #151 | Excellent 11.1% |
| Immigrants | Kazakhstan | 81.7 /100 | #152 | Excellent 11.1% |
| Lebanese | 81.6 /100 | #153 | Excellent 11.1% |
Demographics Similar to Fijians by Receiving Food Stamps
In terms of receiving food stamps, the demographic groups most similar to Fijians are Immigrants from Armenia (13.0%, a difference of 0.020%), Immigrants from Albania (13.0%, a difference of 0.090%), Immigrants (13.0%, a difference of 0.13%), Bermudan (13.0%, a difference of 0.39%), and Chickasaw (13.1%, a difference of 0.60%).
| Demographics | Rating | Rank | Receiving Food Stamps |
| Hawaiians | 5.4 /100 | #218 | Tragic 12.9% |
| Immigrants | Middle Africa | 5.4 /100 | #219 | Tragic 12.9% |
| Immigrants | Colombia | 5.3 /100 | #220 | Tragic 12.9% |
| Bermudans | 4.8 /100 | #221 | Tragic 13.0% |
| Immigrants | Immigrants | 4.4 /100 | #222 | Tragic 13.0% |
| Immigrants | Albania | 4.4 /100 | #223 | Tragic 13.0% |
| Immigrants | Armenia | 4.3 /100 | #224 | Tragic 13.0% |
| Fijians | 4.3 /100 | #225 | Tragic 13.0% |
| Chickasaw | 3.6 /100 | #226 | Tragic 13.1% |
| Nigerians | 3.5 /100 | #227 | Tragic 13.1% |
| Panamanians | 3.5 /100 | #228 | Tragic 13.1% |
| Ottawa | 3.5 /100 | #229 | Tragic 13.1% |
| Puget Sound Salish | 3.4 /100 | #230 | Tragic 13.1% |
| Immigrants | Nigeria | 3.4 /100 | #231 | Tragic 13.1% |
| Salvadorans | 2.7 /100 | #232 | Tragic 13.2% |