Romanian vs Fijian Unemployment
COMPARE
Romanian
Fijian
Unemployment
Unemployment Comparison
Romanians
Fijians
5.0%
UNEMPLOYMENT
95.0/ 100
METRIC RATING
98th/ 347
METRIC RANK
5.0%
UNEMPLOYMENT
97.6/ 100
METRIC RATING
82nd/ 347
METRIC RANK
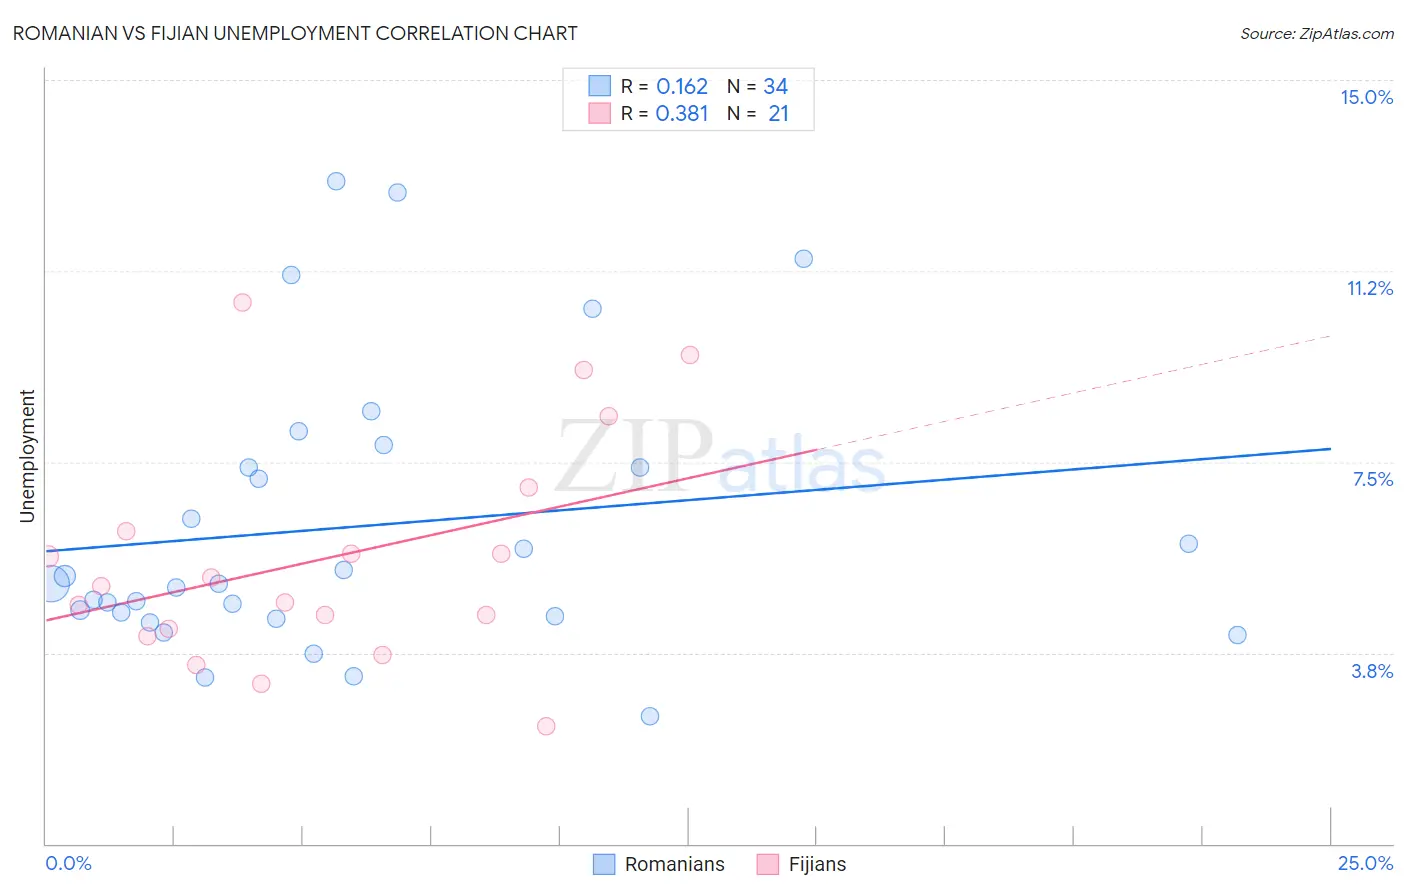
Romanian vs Fijian Unemployment Correlation Chart
The statistical analysis conducted on geographies consisting of 377,537,614 people shows a poor positive correlation between the proportion of Romanians and unemployment in the United States with a correlation coefficient (R) of 0.162 and weighted average of 5.0%. Similarly, the statistical analysis conducted on geographies consisting of 55,931,908 people shows a mild positive correlation between the proportion of Fijians and unemployment in the United States with a correlation coefficient (R) of 0.381 and weighted average of 5.0%, a difference of 1.2%.
Unemployment Correlation Summary
| Measurement | Romanian | Fijian |
| Minimum | 2.5% | 2.3% |
| Maximum | 13.0% | 10.6% |
| Range | 10.5% | 8.3% |
| Mean | 6.2% | 5.6% |
| Median | 5.1% | 5.1% |
| Interquartile 25% (IQ1) | 4.5% | 4.1% |
| Interquartile 75% (IQ3) | 7.4% | 6.6% |
| Interquartile Range (IQR) | 2.9% | 2.4% |
| Standard Deviation (Sample) | 2.8% | 2.2% |
| Standard Deviation (Population) | 2.7% | 2.2% |
Demographics Similar to Romanians and Fijians by Unemployment
In terms of unemployment, the demographic groups most similar to Romanians are Immigrants from Czechoslovakia (5.0%, a difference of 0.030%), Immigrants from England (5.0%, a difference of 0.060%), Mongolian (5.0%, a difference of 0.070%), Estonian (5.0%, a difference of 0.13%), and Immigrants from Serbia (5.0%, a difference of 0.22%). Similarly, the demographic groups most similar to Fijians are Basque (5.0%, a difference of 0.010%), Hmong (5.0%, a difference of 0.010%), Immigrants from Sweden (5.0%, a difference of 0.020%), Russian (5.0%, a difference of 0.090%), and Immigrants from Australia (5.0%, a difference of 0.37%).
| Demographics | Rating | Rank | Unemployment |
| Immigrants | Sweden | 97.6 /100 | #80 | Exceptional 5.0% |
| Basques | 97.6 /100 | #81 | Exceptional 5.0% |
| Fijians | 97.6 /100 | #82 | Exceptional 5.0% |
| Hmong | 97.6 /100 | #83 | Exceptional 5.0% |
| Russians | 97.4 /100 | #84 | Exceptional 5.0% |
| Immigrants | Australia | 97.0 /100 | #85 | Exceptional 5.0% |
| Hungarians | 96.9 /100 | #86 | Exceptional 5.0% |
| Immigrants | Moldova | 96.6 /100 | #87 | Exceptional 5.0% |
| Immigrants | Korea | 96.6 /100 | #88 | Exceptional 5.0% |
| Jordanians | 96.4 /100 | #89 | Exceptional 5.0% |
| Immigrants | North Macedonia | 96.3 /100 | #90 | Exceptional 5.0% |
| Immigrants | Sudan | 96.3 /100 | #91 | Exceptional 5.0% |
| Immigrants | South Africa | 96.2 /100 | #92 | Exceptional 5.0% |
| Ukrainians | 96.0 /100 | #93 | Exceptional 5.0% |
| Immigrants | Austria | 95.9 /100 | #94 | Exceptional 5.0% |
| Immigrants | Serbia | 95.6 /100 | #95 | Exceptional 5.0% |
| Immigrants | England | 95.2 /100 | #96 | Exceptional 5.0% |
| Immigrants | Czechoslovakia | 95.1 /100 | #97 | Exceptional 5.0% |
| Romanians | 95.0 /100 | #98 | Exceptional 5.0% |
| Mongolians | 94.8 /100 | #99 | Exceptional 5.0% |
| Estonians | 94.6 /100 | #100 | Exceptional 5.0% |