Pueblo vs Mongolian Single Mother Poverty
COMPARE
Pueblo
Mongolian
Single Mother Poverty
Single Mother Poverty Comparison
Pueblo
Mongolians
37.2%
SINGLE MOTHER POVERTY
0.0/ 100
METRIC RATING
334th/ 347
METRIC RANK
27.7%
SINGLE MOTHER POVERTY
98.7/ 100
METRIC RATING
85th/ 347
METRIC RANK
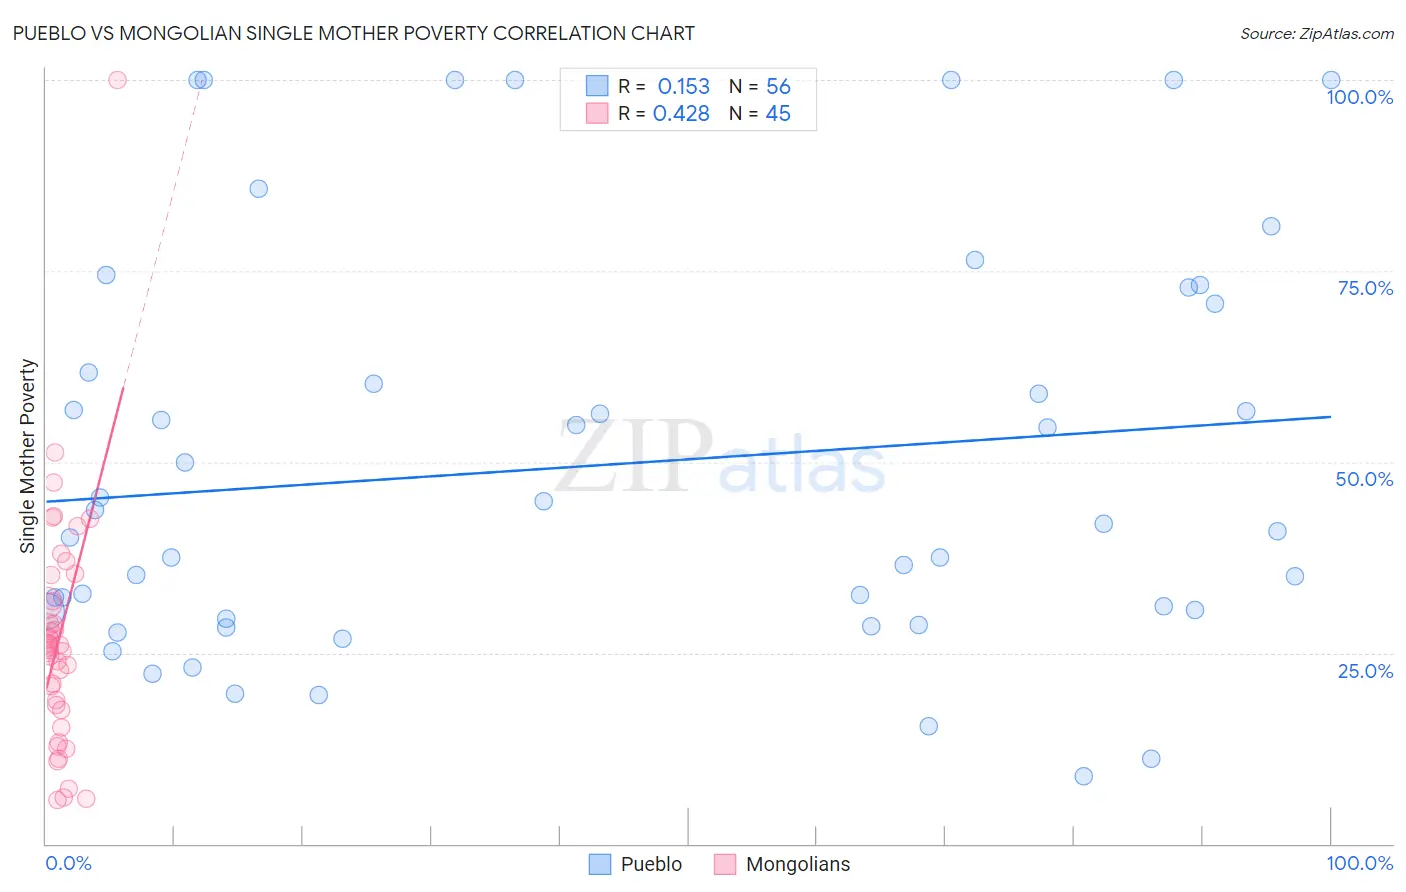
Pueblo vs Mongolian Single Mother Poverty Correlation Chart
The statistical analysis conducted on geographies consisting of 119,257,256 people shows a poor positive correlation between the proportion of Pueblo and poverty level among single mothers in the United States with a correlation coefficient (R) of 0.153 and weighted average of 37.2%. Similarly, the statistical analysis conducted on geographies consisting of 139,079,734 people shows a moderate positive correlation between the proportion of Mongolians and poverty level among single mothers in the United States with a correlation coefficient (R) of 0.428 and weighted average of 27.7%, a difference of 34.5%.
Single Mother Poverty Correlation Summary
| Measurement | Pueblo | Mongolian |
| Minimum | 8.8% | 5.8% |
| Maximum | 100.0% | 100.0% |
| Range | 91.2% | 94.2% |
| Mean | 49.5% | 27.0% |
| Median | 41.4% | 25.8% |
| Interquartile 25% (IQ1) | 30.0% | 17.8% |
| Interquartile 75% (IQ3) | 66.2% | 33.5% |
| Interquartile Range (IQR) | 36.2% | 15.6% |
| Standard Deviation (Sample) | 26.2% | 15.8% |
| Standard Deviation (Population) | 26.0% | 15.7% |
Similar Demographics by Single Mother Poverty
Demographics Similar to Pueblo by Single Mother Poverty
In terms of single mother poverty, the demographic groups most similar to Pueblo are Menominee (37.1%, a difference of 0.37%), Dutch West Indian (36.8%, a difference of 1.2%), Creek (36.7%, a difference of 1.4%), Yuman (37.8%, a difference of 1.5%), and Native/Alaskan (36.6%, a difference of 1.6%).
| Demographics | Rating | Rank | Single Mother Poverty |
| Yakama | 0.0 /100 | #327 | Tragic 36.4% |
| Choctaw | 0.0 /100 | #328 | Tragic 36.4% |
| Apache | 0.0 /100 | #329 | Tragic 36.6% |
| Natives/Alaskans | 0.0 /100 | #330 | Tragic 36.6% |
| Creek | 0.0 /100 | #331 | Tragic 36.7% |
| Dutch West Indians | 0.0 /100 | #332 | Tragic 36.8% |
| Menominee | 0.0 /100 | #333 | Tragic 37.1% |
| Pueblo | 0.0 /100 | #334 | Tragic 37.2% |
| Yuman | 0.0 /100 | #335 | Tragic 37.8% |
| Cheyenne | 0.0 /100 | #336 | Tragic 38.5% |
| Immigrants | Yemen | 0.0 /100 | #337 | Tragic 38.5% |
| Pima | 0.0 /100 | #338 | Tragic 38.6% |
| Crow | 0.0 /100 | #339 | Tragic 38.6% |
| Sioux | 0.0 /100 | #340 | Tragic 38.8% |
| Colville | 0.0 /100 | #341 | Tragic 39.3% |
Demographics Similar to Mongolians by Single Mother Poverty
In terms of single mother poverty, the demographic groups most similar to Mongolians are Immigrants from Latvia (27.7%, a difference of 0.0%), Greek (27.7%, a difference of 0.040%), Immigrants from Cameroon (27.6%, a difference of 0.090%), Immigrants from Ukraine (27.7%, a difference of 0.090%), and Afghan (27.7%, a difference of 0.19%).
| Demographics | Rating | Rank | Single Mother Poverty |
| Immigrants | North Macedonia | 99.2 /100 | #78 | Exceptional 27.5% |
| Immigrants | Italy | 99.1 /100 | #79 | Exceptional 27.5% |
| Taiwanese | 99.1 /100 | #80 | Exceptional 27.5% |
| Immigrants | Scotland | 98.9 /100 | #81 | Exceptional 27.6% |
| Immigrants | Cameroon | 98.8 /100 | #82 | Exceptional 27.6% |
| Greeks | 98.7 /100 | #83 | Exceptional 27.7% |
| Immigrants | Latvia | 98.7 /100 | #84 | Exceptional 27.7% |
| Mongolians | 98.7 /100 | #85 | Exceptional 27.7% |
| Immigrants | Ukraine | 98.6 /100 | #86 | Exceptional 27.7% |
| Afghans | 98.5 /100 | #87 | Exceptional 27.7% |
| Ethiopians | 98.4 /100 | #88 | Exceptional 27.7% |
| Immigrants | Ethiopia | 98.4 /100 | #89 | Exceptional 27.7% |
| Immigrants | France | 98.2 /100 | #90 | Exceptional 27.8% |
| Immigrants | Albania | 98.0 /100 | #91 | Exceptional 27.8% |
| Estonians | 97.9 /100 | #92 | Exceptional 27.8% |