Pueblo vs Immigrants from Brazil Single Mother Poverty
COMPARE
Pueblo
Immigrants from Brazil
Single Mother Poverty
Single Mother Poverty Comparison
Pueblo
Immigrants from Brazil
37.2%
SINGLE MOTHER POVERTY
0.0/ 100
METRIC RATING
334th/ 347
METRIC RANK
27.9%
SINGLE MOTHER POVERTY
97.2/ 100
METRIC RATING
97th/ 347
METRIC RANK
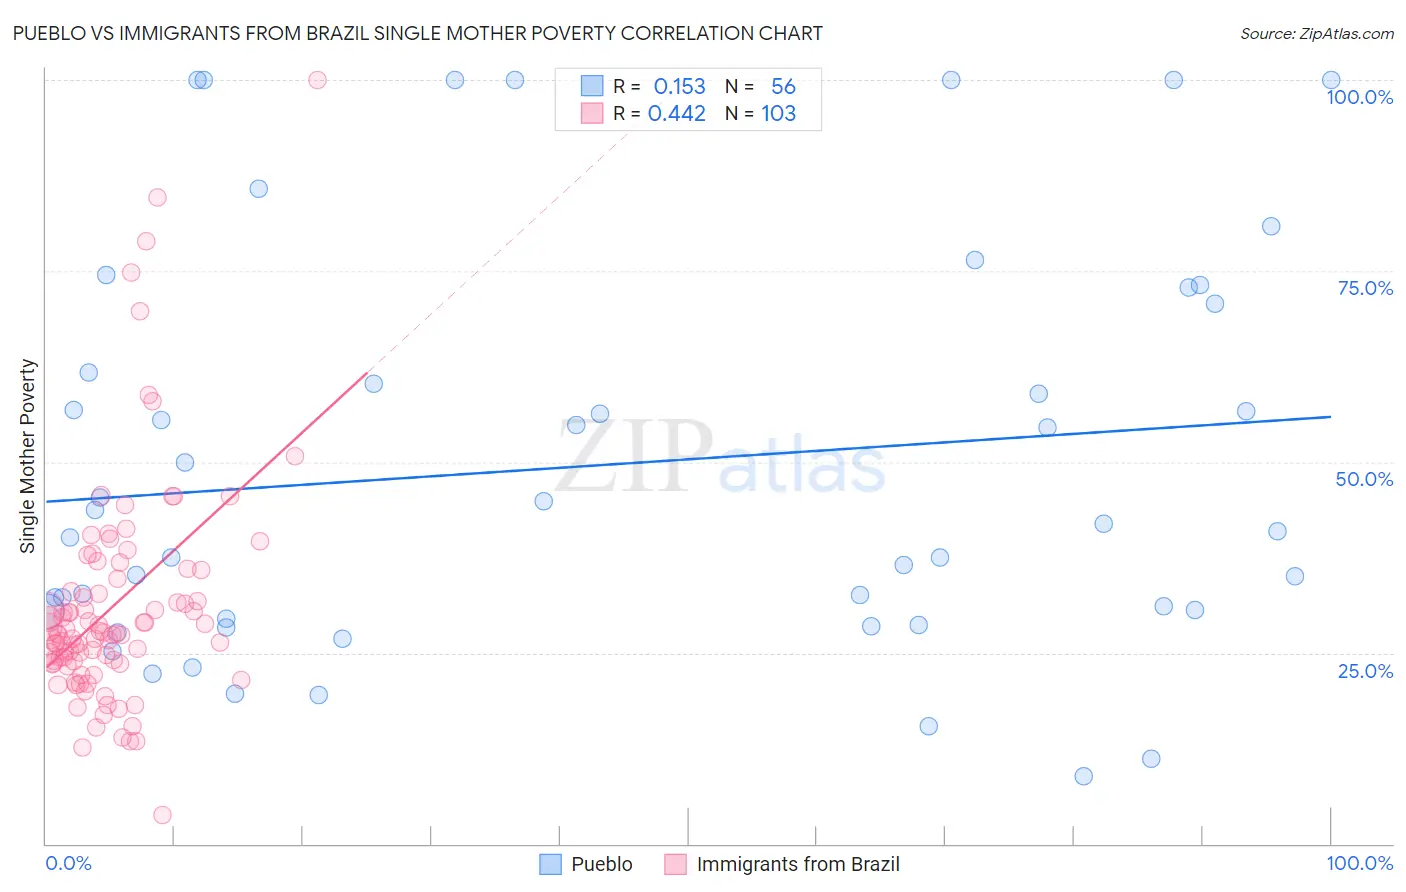
Pueblo vs Immigrants from Brazil Single Mother Poverty Correlation Chart
The statistical analysis conducted on geographies consisting of 119,257,256 people shows a poor positive correlation between the proportion of Pueblo and poverty level among single mothers in the United States with a correlation coefficient (R) of 0.153 and weighted average of 37.2%. Similarly, the statistical analysis conducted on geographies consisting of 334,860,150 people shows a moderate positive correlation between the proportion of Immigrants from Brazil and poverty level among single mothers in the United States with a correlation coefficient (R) of 0.442 and weighted average of 27.9%, a difference of 33.2%.
Single Mother Poverty Correlation Summary
| Measurement | Pueblo | Immigrants from Brazil |
| Minimum | 8.8% | 3.8% |
| Maximum | 100.0% | 100.0% |
| Range | 91.2% | 96.2% |
| Mean | 49.5% | 31.0% |
| Median | 41.4% | 27.5% |
| Interquartile 25% (IQ1) | 30.0% | 23.7% |
| Interquartile 75% (IQ3) | 66.2% | 34.7% |
| Interquartile Range (IQR) | 36.2% | 11.1% |
| Standard Deviation (Sample) | 26.2% | 14.8% |
| Standard Deviation (Population) | 26.0% | 14.7% |
Similar Demographics by Single Mother Poverty
Demographics Similar to Pueblo by Single Mother Poverty
In terms of single mother poverty, the demographic groups most similar to Pueblo are Menominee (37.1%, a difference of 0.37%), Dutch West Indian (36.8%, a difference of 1.2%), Creek (36.7%, a difference of 1.4%), Yuman (37.8%, a difference of 1.5%), and Native/Alaskan (36.6%, a difference of 1.6%).
| Demographics | Rating | Rank | Single Mother Poverty |
| Yakama | 0.0 /100 | #327 | Tragic 36.4% |
| Choctaw | 0.0 /100 | #328 | Tragic 36.4% |
| Apache | 0.0 /100 | #329 | Tragic 36.6% |
| Natives/Alaskans | 0.0 /100 | #330 | Tragic 36.6% |
| Creek | 0.0 /100 | #331 | Tragic 36.7% |
| Dutch West Indians | 0.0 /100 | #332 | Tragic 36.8% |
| Menominee | 0.0 /100 | #333 | Tragic 37.1% |
| Pueblo | 0.0 /100 | #334 | Tragic 37.2% |
| Yuman | 0.0 /100 | #335 | Tragic 37.8% |
| Cheyenne | 0.0 /100 | #336 | Tragic 38.5% |
| Immigrants | Yemen | 0.0 /100 | #337 | Tragic 38.5% |
| Pima | 0.0 /100 | #338 | Tragic 38.6% |
| Crow | 0.0 /100 | #339 | Tragic 38.6% |
| Sioux | 0.0 /100 | #340 | Tragic 38.8% |
| Colville | 0.0 /100 | #341 | Tragic 39.3% |
Demographics Similar to Immigrants from Brazil by Single Mother Poverty
In terms of single mother poverty, the demographic groups most similar to Immigrants from Brazil are Immigrants from Nepal (27.9%, a difference of 0.010%), Immigrants from Netherlands (27.9%, a difference of 0.020%), Immigrants from Iraq (27.9%, a difference of 0.040%), Zimbabwean (27.9%, a difference of 0.070%), and Pakistani (28.0%, a difference of 0.13%).
| Demographics | Rating | Rank | Single Mother Poverty |
| Immigrants | France | 98.2 /100 | #90 | Exceptional 27.8% |
| Immigrants | Albania | 98.0 /100 | #91 | Exceptional 27.8% |
| Estonians | 97.9 /100 | #92 | Exceptional 27.8% |
| Romanians | 97.8 /100 | #93 | Exceptional 27.8% |
| Albanians | 97.6 /100 | #94 | Exceptional 27.9% |
| Chileans | 97.5 /100 | #95 | Exceptional 27.9% |
| Immigrants | Iraq | 97.3 /100 | #96 | Exceptional 27.9% |
| Immigrants | Brazil | 97.2 /100 | #97 | Exceptional 27.9% |
| Immigrants | Nepal | 97.2 /100 | #98 | Exceptional 27.9% |
| Immigrants | Netherlands | 97.2 /100 | #99 | Exceptional 27.9% |
| Zimbabweans | 97.1 /100 | #100 | Exceptional 27.9% |
| Pakistanis | 96.9 /100 | #101 | Exceptional 28.0% |
| Immigrants | Croatia | 96.7 /100 | #102 | Exceptional 28.0% |
| Immigrants | Northern Africa | 96.6 /100 | #103 | Exceptional 28.0% |
| Italians | 96.6 /100 | #104 | Exceptional 28.0% |