Pueblo vs Immigrants from Latin America Female Poverty
COMPARE
Pueblo
Immigrants from Latin America
Female Poverty
Female Poverty Comparison
Pueblo
Immigrants from Latin America
20.7%
FEMALE POVERTY
0.0/ 100
METRIC RATING
336th/ 347
METRIC RANK
16.4%
FEMALE POVERTY
0.0/ 100
METRIC RATING
293rd/ 347
METRIC RANK
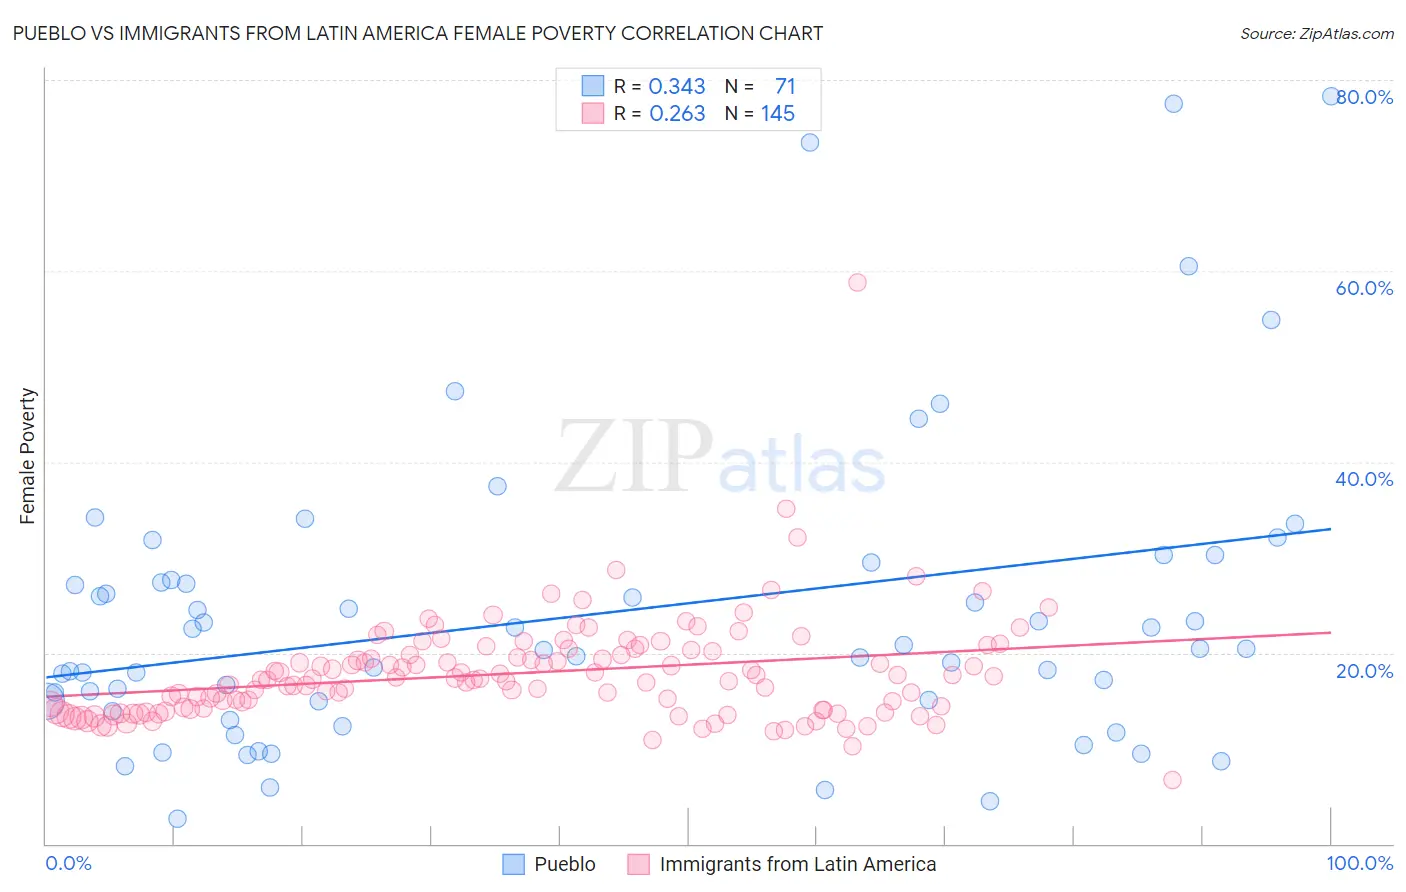
Pueblo vs Immigrants from Latin America Female Poverty Correlation Chart
The statistical analysis conducted on geographies consisting of 120,063,316 people shows a mild positive correlation between the proportion of Pueblo and poverty level among females in the United States with a correlation coefficient (R) of 0.343 and weighted average of 20.7%. Similarly, the statistical analysis conducted on geographies consisting of 557,630,334 people shows a weak positive correlation between the proportion of Immigrants from Latin America and poverty level among females in the United States with a correlation coefficient (R) of 0.263 and weighted average of 16.4%, a difference of 25.8%.
Female Poverty Correlation Summary
| Measurement | Pueblo | Immigrants from Latin America |
| Minimum | 2.6% | 6.7% |
| Maximum | 78.3% | 58.7% |
| Range | 75.6% | 52.1% |
| Mean | 24.0% | 17.9% |
| Median | 20.4% | 17.2% |
| Interquartile 25% (IQ1) | 14.9% | 14.0% |
| Interquartile 75% (IQ3) | 27.6% | 20.2% |
| Interquartile Range (IQR) | 12.7% | 6.2% |
| Standard Deviation (Sample) | 15.8% | 5.5% |
| Standard Deviation (Population) | 15.7% | 5.5% |
Similar Demographics by Female Poverty
Demographics Similar to Pueblo by Female Poverty
In terms of female poverty, the demographic groups most similar to Pueblo are Yuman (20.8%, a difference of 0.81%), Sioux (20.9%, a difference of 1.0%), Hopi (21.0%, a difference of 1.4%), Cheyenne (20.2%, a difference of 2.4%), and Houma (20.0%, a difference of 3.2%).
| Demographics | Rating | Rank | Female Poverty |
| Kiowa | 0.0 /100 | #329 | Tragic 18.6% |
| Dominicans | 0.0 /100 | #330 | Tragic 19.1% |
| Natives/Alaskans | 0.0 /100 | #331 | Tragic 19.2% |
| Apache | 0.0 /100 | #332 | Tragic 19.2% |
| Immigrants | Dominican Republic | 0.0 /100 | #333 | Tragic 19.3% |
| Houma | 0.0 /100 | #334 | Tragic 20.0% |
| Cheyenne | 0.0 /100 | #335 | Tragic 20.2% |
| Pueblo | 0.0 /100 | #336 | Tragic 20.7% |
| Yuman | 0.0 /100 | #337 | Tragic 20.8% |
| Sioux | 0.0 /100 | #338 | Tragic 20.9% |
| Hopi | 0.0 /100 | #339 | Tragic 21.0% |
| Yup'ik | 0.0 /100 | #340 | Tragic 21.5% |
| Crow | 0.0 /100 | #341 | Tragic 22.1% |
| Immigrants | Yemen | 0.0 /100 | #342 | Tragic 22.8% |
| Lumbee | 0.0 /100 | #343 | Tragic 23.5% |
Demographics Similar to Immigrants from Latin America by Female Poverty
In terms of female poverty, the demographic groups most similar to Immigrants from Latin America are Immigrants from Cabo Verde (16.4%, a difference of 0.030%), Immigrants from Zaire (16.4%, a difference of 0.060%), Yaqui (16.4%, a difference of 0.070%), Senegalese (16.5%, a difference of 0.11%), and Immigrants from Senegal (16.5%, a difference of 0.13%).
| Demographics | Rating | Rank | Female Poverty |
| Inupiat | 0.0 /100 | #286 | Tragic 16.2% |
| Immigrants | Belize | 0.0 /100 | #287 | Tragic 16.3% |
| Indonesians | 0.0 /100 | #288 | Tragic 16.4% |
| Blackfeet | 0.0 /100 | #289 | Tragic 16.4% |
| Immigrants | Bangladesh | 0.0 /100 | #290 | Tragic 16.4% |
| Yaqui | 0.0 /100 | #291 | Tragic 16.4% |
| Immigrants | Zaire | 0.0 /100 | #292 | Tragic 16.4% |
| Immigrants | Latin America | 0.0 /100 | #293 | Tragic 16.4% |
| Immigrants | Cabo Verde | 0.0 /100 | #294 | Tragic 16.4% |
| Senegalese | 0.0 /100 | #295 | Tragic 16.5% |
| Immigrants | Senegal | 0.0 /100 | #296 | Tragic 16.5% |
| Mexicans | 0.0 /100 | #297 | Tragic 16.5% |
| Somalis | 0.0 /100 | #298 | Tragic 16.6% |
| Hispanics or Latinos | 0.0 /100 | #299 | Tragic 16.6% |
| Bahamians | 0.0 /100 | #300 | Tragic 16.6% |